
Your survey response rate falls below expectations? In 2025, the survey responses average across all channels stands at just 33%, but it varies drastically depending on how you collect feedback. The channel you pick to gather customer feedback matters.
Here’s a channel-by-channel benchmarks in 2025:
Excellent = 50%+; Good = 5–30% depending on context.
These typical response rates by channel can help you set realistic goals and pick the right approach for your feedback strategy. This blog will show you current survey response rates by industry, ways to boost participation, and methods to set meaningful standards for your business.
Learn more about what counts as a good or acceptable survey response rate.
How to Calculate Survey Response Rate Accurately
You need to understand the precise mathematics behind response metrics to measure survey effectiveness accurately. Getting this calculation right will give a reliable and practical feedback data. Let's get into the exact formulas and differences between commonly confused metrics.
Formula: Completed Surveys ÷ Total Sent × 100
The standard formula to calculate survey response rate is straightforward:
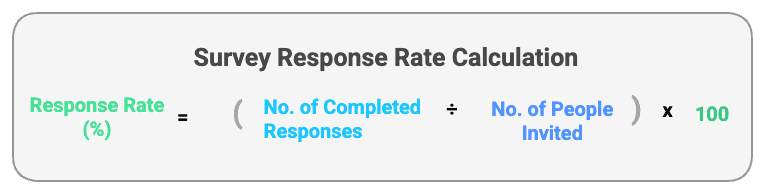
To name just one example, if you sent your survey to 500 people and 200 completed it, your response rate would be (200 ÷ 500) × 100 = 40%. This simple calculation shows the percentage of people who fully completed your survey from the total invited population.
For more accurate stats, check out the AAPOR RR3 method, which excludes ineligible recipients. See our step-by-step guide on how to calculate survey response rate.
Difference Between View Rate and Completion Rate
View rate and completion rate measure different aspects of survey involvement:
- View Rate: Percentage of people who opened/viewed your survey
- Completion Rate: Percentage of people who finished your survey after starting it
Here's an example to clarify: If you sent 500 survey invitations, 250 people opened the survey, and 200 completed it, your completion rate would be (200 ÷ 250) × 100 = 80%.
Both metrics offer valuable insights. High view rates with low completion rates often signal issues with survey length or clarity. Low view rates with high completion rates might point to problems with your original outreach method rather than the survey itself.
Survey Participation Rate vs. Response Rate
Participation rate and response rate measure different aspects of survey involvement, though people often confuse them:
- Participation Rate: Percentage of people who answered at least one question of your survey
- Response Rate: Percentage of people who completed the entire survey
Here's how these differences work: If you sent a pulse survey with 5 questions to 10 employees, and 6 employees answered at least one question, your participation rate would be 60%. If only 16 questions were answered out of 50 total questions sent, your response rate would be 32%.
Tracking both metrics gives complementary insights. A high participation rate (90%) with a lower completion rate (75%) might show that your survey starts strong but loses respondents along the way. This points to potential improvements in question sequence or survey length.
These nuanced differences help you diagnose survey performance issues accurately and make targeted improvements to your feedback collection strategy.
2025 Survey Response Rate Benchmarks by Channel
Your choice of channel makes a big difference in survey response rates in 2025. Recent industry data shows that each way of collecting feedback produces different results. Let's get into the standard rates for the most common survey channels.
Email Surveys: 15–25% Typical Survey Response Rate
Email surveys are still a popular feedback channel even though engagement rates keep dropping. Current data reveals email survey response rates between 15-25%. Delighted's 2024 analysis shows their users get about 6% for email surveys. Other research suggests the average is closer to 12-15%.
These rates depend on several things. About 50% of Gmail users have the tabbed inbox feature, and only 80% check secondary tabs weekly. Brand emails that land in the primary tab instead of promotional tabs see 30% higher open rates. To maximize the chances of your survey emails reaching the inbox rather than spam folders, you should improve email deliverability by implementing proper authentication and following sender best practices. Email survey response rates drop over time, while surveys built into user workflows show better engagement.
In-App and Web Pop-Ups: 20–30% Participation Rate
In-app and web surveys get much better engagement than regular email surveys. A study of 500 in-app surveys showed average response rates of 25.25% and completion rates of 23.04%. Web-app survey widgets usually get response rates between 15-25%, and many go beyond 30%.
Where you place the survey matters. Central modal pop-ups work best with a 39.9% completion rate. Top-right corner placements get the least engagement. Screeb's customers achieve an average response rate of 55%. Their high performers reach 65-70%, and their top performer hits 87%.
SMS Surveys: 40–50% Response Rate Standard
SMS surveys beat other digital channels consistently. The 2025 Mobile Engagement Report shows text message surveys get response rates between 45-60%. This is a big deal as it means that SMS outperforms email's 6-8%. SMS works better because it's quick and simple.
Text-based NPS surveys are particularly effective since customers just need to reply with one number. The 2024 NPS Benchmarks Report reveals that SMS-collected NPS scores are 5-8 points higher than email surveys. This might be because quick responses reduce negative bias.
Event-Based Surveys: 85–95% Completion Rate
Event surveys get the highest response rates when used strategically. Post-event feedback typically sees 20-30% response rates. In-person collection at events can reach amazing 85-95% completion rates.
Timing is key. Event surveys sent by SMS get 32% more completions when sent within 2 hours after the event ends. The Event Marketing Institute's 2024 Study backs this up - feedback collected within 2 hours scores 40% higher on actionability than delayed surveys.
Tab Surveys: 3–5% Response Rate Reality
Those small "Feedback" buttons on websites get the lowest engagement. Refiner reports just 3-5% response rates for surveys shown to anonymous website visitors. These tabs need customers to take initiative, making them the least effective way to collect feedback.
Web applications that show surveys to logged-in users tell a different story. Their response rates can reach 60-70%. This shows the huge gap between passive and active engagement approaches.
Survey Response Rate Benchmarks by Industry
| Industry | Typical Response Rate | Notes |
|---|---|---|
| Retail / eCommerce | 5–15% | Customer feedback surveys tend to be low |
| Technology / SaaS | 8–20% | Response rates vary by touchpoint |
| Healthcare (Consumer) | 10–30% | Academic surveys: ~54% for doctors, ~70% for patients |
| Financial Services | 10–20% | Organizational surveys show ~57% response |
| Education | 20–30% | Academic org studies show ~49% |
| Hospitality / Travel | 10–25% | Feedback often collected post-stay |
| Employee (Internal) | 60–92% (average ~76%) | High rates for engagement or mandatory internal surveys |
Factors That Influence Survey Response Rates in 2025
Your survey's success in 2025 depends on several factors that determine if people will complete it. Customer feedback programs have expanded in the last few decades, and people are getting tired of surveys. Today's response rates typically fall between 5% and 30%. Learning about these factors will help you create better surveys that get meaningful feedback.
Survey Length and Time to Complete
The length of your survey directly affects how many people finish it. People lose interest in long surveys that take more than 12 minutes to complete. Here's what works best:
- Surveys that take less than 7 minutes get the best completion rates
- People who start a survey usually quit halfway through, whatever the total length
- Short surveys with just 1-3 questions are incredibly effective, with 83.34% of people completing them
Your data quality gets worse as the survey goes on. Research shows people get tired and rush through questions, which leads to less reliable answers. On top of that, it shows people are less likely to use slider questions and give shorter answers to open-ended questions in longer surveys.
Timing of Survey Delivery Post-Interaction
The right timing makes a huge difference in getting quality responses. People give 40% more accurate feedback right after an interaction compared to waiting 24 hours. Here's what else matters:
- Most people (78%) respond to surveys during weekdays
- Wednesday and Thursday are your best bet, with response rates of 17.7% and 17.9%
- Early morning (before 10 AM) and mid-afternoon (2-3 PM) work best
- Don't send surveys during stressful times like quarter-end for businesses or finals week for students
Smart timing around people's natural schedules will boost your participation rates.
Use of Incentives and Their Impact on Bias
Incentives can double your participation rates, but you need to use them wisely. Money talks - even small amounts make a difference:
- A simple $1.00 reward pushed response rates from 11.8% to 26.3%
- Money increases responses by about 19%, while non-monetary rewards bump them up by 8%
All the same, rewards can create bias. People who respond for money tend to be younger and more diverse. Small upfront rewards work better than bigger promises after completion.
Survey Design: Avoiding the Word 'Survey'
Your survey's design and presentation can make or break its success. Simple word choices matter - leaving out "survey" in your subject lines gets more people to open them. Other design tips include:
- Simple layouts with plenty of white space
- Making it work well on mobile (especially for weekend surveys)
- Personal messages that speak directly to people (can boost responses by 48%)
- Easy question formats (multiple-choice works better than open-ended)
Think of your survey as a conversation, not just a way to collect data. This approach makes people more likely to participate.
Customer Engagement and Brand Loyalty
People who care about your brand give more feedback. Research shows that guests who fill out surveys are more emotionally connected to your brand, even when they're not giving perfect scores. Here's what else we know:
- Customers giving perfect scores (10/10) are 44% more likely to come back within a month
- People respond more when they believe you'll act on their feedback
- Taking surveys makes customers more responsive to your targeted campaigns and individual-specific promotions
Your survey respondents are your most engaged customers. They give you great opportunities to build stronger brand relationships beyond just getting feedback.
How to Improve Survey Response Rates Without Bias
Survey response rates improve with strategic planning, not random tactics. Surveys that respect participants' time and intelligence naturally yield better results. Let's look at proven techniques that maximize participation without introducing bias.
Explain the Purpose Clearly in the Introduction
Your survey should start with a transparent introduction that explains why you're collecting feedback. People are more likely to participate if they understand how you'll use their input. Show them what actions you'll take based on their responses. To cite an instance, phrases like "Your feedback will help us improve our checkout process" establish purpose and show value. Trust builds when you include details about anonymity and survey length in the introduction.
Keep Surveys Short and Focused (Under 5 Minutes)
Survey length directly affects completion rates. Your survey should take less than 5 minutes to complete. A survey with 10-15 questions maximizes participation. Research reveals that surveys lasting over 12 minutes see three times more dropouts than those under 5 minutes. Here's how to keep it brief:
- Remove questions you can answer through existing data
- Cut redundant questions that ask the same thing
- Use skip logic to customize question paths
Use Personalized Messaging and Subject Lines
Customized messages substantially boost engagement. Response rates jump when you use a recipient's name in email greetings like "Hello [first_name]". Personalized emails can lift response rates by up to 48%. Subject lines work better with intriguing questions rather than just saying "Survey".
Limit Frequency of Survey Requests
Survey fatigue affects response rates. B2B contexts work best with quarterly surveys. B2C frequency should match customer interaction patterns—usually twice your normal interaction frequency. Space survey invitations at least two months apart for the same recipient.
Test Different Channels and Formats
Each audience responds differently to specific channels. You might want to try:
- SMS for immediate post-interaction feedback (40-50% response rates)
- In-app surveys for active users (20-30% participation)
- QR codes on receipts or packaging for offline experiences
These strategies can transform your survey results. Try SurveySparrow to measure your survey performance with intelligent routing, customization, and multi-channel distribution.
14-day free trial • Cancel Anytime • No Credit Card Required • No Strings Attached
Setting Internal Benchmarks vs. Industry Standards
Survey response rates matched against industry standards might mislead you. Each business operates under unique conditions. Your customized measures prove more valuable than generic averages. Let me show you how to set meaningful standards that fit your specific situation.
Why Industry Averages May Not Apply to You
Industry measures offer a starting point but rarely match your business reality. Survey providers compete fiercely, and the chance that one provider has all your competitors is small. Exact comparisons become difficult because questionnaires differ between companies.
The best approach uses your top-performing internal teams or business units as measures. This strategy helps you learn about proven best practices instead of matching unknown processes.
Segmenting by Customer Type and Tier
To learn about what matters most, break down your survey results by customer traits:
- Demographics of your ideal customer profile
- Product or service type purchased
- Customer spending levels
- Decision-maker status and persona
B2B audiences respond at lower rates (12.4% average) than B2C audiences (potentially 40%+). Customer value segments should guide your measuring—performance tracking among high-value customers prevents their responses from getting lost among less profitable segments.
Using CRM Data to Track Response Trends
Survey data combined with your CRM creates powerful internal measures, though data quality issues exist—72% of companies doubt their customer information accuracy, with up to 91% of data remaining incomplete.
Your measurement questions should match specific business priorities, especially around key performance indicators. The data needs collection at least twice yearly at regular intervals to establish reliable internal trends.
NPS Response Rate Benchmark by Segment
NPS response rates show dramatic differences across channels and segments:
- Email NPS surveys: 15-25% proves satisfactory
- SMS/text surveys: You should aim for 30%+ (often reaching 40-50%)
- B2B programs: 20% response rate shows excellence
- B2C campaigns: These should reach 30%+ engagement
Your NPS will change by audience segment and region. Japanese and South Korean customers give more reserved scores, while those in India and Mexico tend to be more generous when they like a company.
Would you like to establish meaningful measures that fit your business? SurveySparrow helps create segment-specific surveys that consistently outperform generic industry standards.
Conclusion
We've seen how survey response rates change across channels and industries. Chasing the "perfect" number isn't the goal but to focus on building a strategy that fits your audience and your business model.
Benchmark data gives you the direction in which you need to work towards but your real competitive edges comes from your own performance trends. Test out different channels, formals, and timings to find out what drives the highest engagement in your context.
Shorter surveys works best, along with the right channel, timing and personalisation might just turn your average survey into a two-way conversation.
Ultimately, surveys aren’t just about data but about relationships. Every survey response is a signal of trust and a chance to build loyalty. Treat your respondents like the valuable partners they are, and they’ll keep showing up to push your business forward.


 Software")
