Survey & Feedback
How to Calculate Standard Deviation for Surveys (Formula+Calculator)
Master standard deviation calculation with this comprehensive guide that breaks down formulas, Excel techniques, and online tools to help you analyze data variability and make informed statistical decisions.
")
TRUSTED BY BEST-IN-CLASS BRANDS


Watch Customer Stories
Looking to learn how to calculate standard deviation?
In this article, we show you the three simple ways to calculate standard deviation. We also explain a little bit about what standard deviation is and why it could be important and useful to you.
Moreover, we answer some of the frequently asked questions about standard deviation.
Here’s everything we’ll cover in this article:
- What is Standard Deviation?
- Standard Deviation Formula
- How to Calculate Standard Deviation using Formulas By Hand
- Steps for Calculating Standard Deviation in Excel
- Calculating Standard Deviation using an Online Calculator
- Why Standard Deviation is Important to Marketers
- FAQs about Standard Deviation
What is Standard Deviation?
Standard Deviation is the average amount of variation in a set of data points. Simply put:
- It tells you how much a value (or data point) has deviated from the mean value.
- It measures how widely a set of values swing back and forth from the mean.
- Standard deviation is commonly abbreviated as SD and denoted by “σ”.
- When your set of data points or values is far from the mean, this indicates a higher standard deviation. Conversely, a lower standard deviation indicates that your data points are closer to the mean.
What does standard deviation tell you?
- Using standard deviation, you can learn how further away each value is from the mean.
- It is especially useful for normal distributions since the data is symmetrically distributed in normal distributions. In normal distributions, it tells you how far each data point is from the center of the distribution.
- Standard Deviation is often used by investors and financial professionals to measure the volatility of a data set and assess an investment’s level of risk.
- You can tell how volatile an investment is by the number of data points that deviate from the mean. The more the data points deviate from the mean, the more volatile the investment is.
- Likewise, Standard Deviation can help marketers decide on the budget of a marketing campaign based on the standard deviation of the ROI.
What’s the difference between Standard Deviation and Variance?
Variance and standard deviation are two ways to measure how spread out or different data points are in a dataset. Although they both tell us about the variability in the data, they have some differences.
Variance:
The variance shows how far each number in a dataset is from the average or mean. It gives us an idea of how much the numbers deviate from the average, which is measured in squared units. To calculate variance, we find the average of the squared differences between each data point and the mean.
Standard Deviation:
Standard deviation, on the other hand, is the square root of the variance. It tells us the average amount of deviation or spread of the data points from the mean. The standard deviation is measured in the same units as the original data, which makes it easier to understand and relate to the real-world context.
Here are some key points to remember when considering variance and standard deviation:
- Variance and standard deviation are both measures of how data points vary or spread out in a dataset.
- While variance quantifies the average squared deviations from the mean, standard deviation is derived as the square root of that variance.
- Measured in squared units, variance contrasts with standard deviation, which uses the data’s original units.
- Standard deviation is commonly used and easier to interpret because it is in the same units as the data.
- Variance and standard deviation provide valuable insights into data variability, helping us understand the distribution and spread of values.
- When comparing datasets, the standard deviation is often more useful as it allows for a direct comparison of the spread, while variance may produce larger values due to the squaring of differences.
- Both variance and standard deviation are sensitive to outliers, meaning that extreme values can significantly impact their values.
- It’s essential to consider the context and purpose of your analysis when choosing to use variance or standard deviation.
- Variance and standard deviation are fundamental concepts in statistics and are crucial in various fields, including finance, research, and data analysis.
The Standard Deviation is the square root of the data’s variance.
You calculate the Standard Deviation by taking the square root of the Variance. The more your data points vary, the higher the variance.

How to Find Standard Deviation: The Standard Deviation Formula
Depending on the data you have, the way you calculate standard deviation changes.
- You’ve got one formula that helps you calculate the standard deviation when the data is from a whole population.
- And you’ve got another when the data is from a sample.
#1. Population Standard Deviation Formula
You can calculate the population standard deviation from the data you’ve collected from every member of the population.
Here’s the population standard deviation formula:
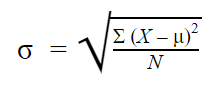
Here,
- σ = population standard deviation
- ∑ = sum of
- X = each value
- μ = assumed population mean
- N = number of values in the population
#2. Sample Standard Deviation Formula
Calculate sample standard deviation with the data you’ve collected from a specific sample.
Here’s the sample standard deviation formula:
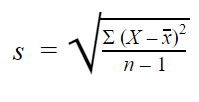
Here,
- s = sample standard deviation
- ∑ = sum of
- X = each value
- x̅ = arithmetic mean of the observations
- n = number of values in that sample
The above two formulas may seem confusing, so below, we’ve listed the steps to put those formulas to use.
However, you can make it easy on yourself and use an online calculator instead. Jump to this section ↓ where we show you how to calculate the standard deviation using an online calculator.

How to Calculate Standard Deviation using Formulas By Hand
Anyway, here are the steps to calculate the standard deviation using the above formulas:
Step 1: Calculate Your Data set’s Mean Value
First, simply add up all the data points and divide them by the number of data points.
Step 2: Calculate Each Data Point’s Deviation from the Mean
Second, subtract the mean value from each data point to find the deviation from the mean.
Step 3: Square Each Deviation from the Mean
Third, multiply each deviation by itself to square them.
Step 4: Find the Sum of All the Squared Deviations
Next, simply add up all of the squared deviations.
Step 5: Find the Variance
Then, divide the sum of all the squared deviations by n -1 (for a sample) or N (for a population).
Step 6: Find the Square Root of the Variance
Finally, take the square root of the variance to find the standard deviation.
How to Calculate Standard Deviation in Excel
If you already use Excel as part of your current workflow, you’re in luck!
Microsoft Excel can quickly calculate standard deviation if you know which formulas and commands to use. In this article, we will explain what standard deviation is, show you how to use Excel to calculate it, and provide an example to help you understand better.
Let’s say you have a list of numbers in Excel. We’ll use the example of numbers in column A from A1 to A10.
To calculate the standard deviation, you can use the STDEV or STDEV.S function in Excel. These formulas will find out how much the numbers in your data set vary from the average. If you have all the data from a population, you can use the STDEV.P function instead.
Unlock deeper insights! Sign up for free now to discover more.
Here are the steps to calculate the standard deviation in Excel:
Enter your data: First, enter your numbers into an Excel worksheet. For example, let’s say you have the numbers 10, 12, 11, 14, 15, 9, 13, 12, 11, and 10 in column A.
Use the formula: In Excel, you can use the STDEV function to calculate the standard deviation. In an empty cell, type the following formula:
=STDEV(A1:A10)
This formula tells Excel to calculate the standard deviation using the numbers in cells A1 to A10.
Press Enter: After typing the formula, press Enter on your keyboard. Excel will calculate the standard deviation for your data and show the result.
Excel has other standard deviation functions that you can use for different situations. For example, if you have multiple data sets or want to use different weighting schemes, there are functions like STDEVA, STDEVP, STDEVPA, STDEVS, and STDEV.P available.
By using Excel’s standard deviation functions, you can quickly analyze how much your data varies and make informed decisions based on the results.
Example:
Let’s say you have the sales figures for a product over ten days: 10, 12, 11, 14, 15, 9, 13, 12, 11, and 10.
To calculate the standard deviation of these sales figures using Excel, follow these steps.
Type the formula “=STDEV(A1:A10)” in an empty cell. When you press Enter, Excel will show the result, which is approximately 1.71 (rounded to two decimal places).
This standard deviation value tells us how the sales figures vary. A higher standard deviation means the sales numbers have a wider range and more variation. A lower standard deviation means the sales figures are closer to each other and have less variation.
There are 6 formulas in Excel that’ll help you calculate the standard deviation. Here are the formulas or Excel functions:
STDEV (or STDEV.S)
The STDEV (or STDEV.S) is a sample standard deviation formula. Use this formula when you want to calculate sample standard deviation without having to account for any text or logical values. And yes, these formulas will work with the older versions of Excel.
STDEVA
Use this formula when you want to calculate sample standard deviation, but you also want to include text and logical values. All the false logical values will be read as 0 and true logical values as 1.
STDEV.P, STDEVPA, and STDEVP
These are the prebuilt functions you use to calculate the population standard deviation. Also, you can calculate the population standard deviation by applying your sample standard deviations to the larger dataset.
Standard Deviation Excel Formula
Here’s the syntax of the stand deviation formula in Excel for STDEV.S:
STDEV.S (number1,[number2],…)
The STDEV.S function uses the following arguments:
Number 1 (required number argument): The first argument that corresponds to the sample of the population
Number 2 (optional number argument): An optional argument that corresponds to a second sample of the population
How to Calculate Standard Deviation Using an Online Calculator
How do you find the standard deviation online quickly? You can use an online standard deviation calculator to find the standard deviation in 3 simple steps. Follow the steps below to quickly find the standard deviation:
Step 1: Enter Your Data Set into the Calculator
First, enter your data points or numbers, separated by commas.
Step 2: Select the Correct Standard Deviation
Now, depending on whether you want to calculate the population standard deviation or the sample standard deviation, click on the “Population” or “Sample” radio button.
Step 3: Calculate
Finally, click the “Calculate” button to find the standard deviation, variance, mean, sum of squares, and margin of error. Then, click “Clear” instead if you want to clear the data you’ve entered and re-enter the data.

Why is Standard Deviation Important and Useful?
- Standard Deviation is especially useful if you want to know the extent to which your data set is unevenly spread out. It tells you not only how spread out your data is but also how unevenly distributed it is.
- It’s a superior way to calculate variability because it gives you a better idea of your data’s variability than simpler measures like Mean Absolute Deviation (MAD).
- Standard Deviation is used to show variability in a data set and its risks and volatility.
- Marketers can use standard deviation to show the potential risk and rewards of a marketing campaign and make the best possible decisions based on data.
- Investors can better assess the risks associated with an investment by accurately predicting an investment’s rate of return.

Average Deviation
Average deviation, which is also known as mean absolute deviation (MAD), is a way to measure how much the individual data points in a dataset differ from the average or mean. It helps us understand the spread or dispersion of the data and gives us an idea of the typical variation from the average value.
To calculate the average deviation, follow these steps:
- Find the mean (average) of the dataset by adding up all the numbers and dividing the sum by the total count of numbers.
- For each data point, subtract the mean and take the absolute value of the difference. This gives you the absolute difference between each data point and the mean.
- Calculate the average of these absolute differences by adding them up and dividing the sum by the total count of numbers.
The importance of average deviation can be seen in the following points:
Simplicity: Average deviation is easy to calculate and understand, especially compared to more complex measures like variance or standard deviation.
Retains Original Units: Unlike variance, which uses squared units, average deviation keeps the same units as the original data. This makes it easier to interpret and relate to real-world values.
Robustness to Outliers: Average deviation is less affected by extreme values (outliers) than variance or standard deviation. Outliers have a stronger influence on squared differences but contribute equally to absolute differences.
Quick Assessment of Variation: Average deviation shows how much the individual data points deviate from the mean on average. It helps identify datasets with high or low variability and allows for comparisons between different datasets.
Complementary Measure: Average deviation complements other measures like variance and standard deviation. It provides an alternative perspective and is particularly useful when working with skewed or non-normally distributed data.
Practical Applications: Average deviation is applied in various fields such as finance, economics, quality control, and data analysis. It aids in understanding data variability, evaluating model performance, assessing forecast accuracy, and making informed decisions based on the data spread.
Calculating the average deviation allows us to measure and understand the typical variation from the mean in a dataset.
Its simplicity, retention of original units, robustness to outliers, and practical applications make it a valuable tool for analyzing data and drawing meaningful conclusions about its spread or dispersion.
The main difference between standard deviation and average deviation lies in their calculation methods and the interpretation of their results.
Frequently Asked Questions about Standard Deviation
What Does Standard Deviation Tell You?
A standard deviation is a measure of how dispersed the data is in relation to the mean. It indicates the extent of deviation from the mean for a data set as a whole.
What is a Normal Distribution?
It’s a distribution wherein values lie in a symmetrical fashion mostly situated around the mean. In other words, in a normal distribution, data is symmetrically distributed. It shows that data near the mean is more frequent in occurrence than data far from the mean.
What are the Different Measures of Variability?
The 4 main measures of variability are Range, Interquartile Range, Standard Deviation, and Variance.
What is the Difference Between Variance and Standard Deviation?
The main difference is in the units. The standard deviation is in the units of variable you’re looking at while the units of variance are the square of those units.
What is the Empirical Rule?
The Empirical Rule, often called the Three-sigma Rule or 68-95-99.7 Rule, asserts that in a normal distribution, 68% of the data falls within one standard deviation of the mean. Additionally, 95% of the data resides within two standard deviations. Furthermore, a whopping 99.7% lies within three standard deviations of the mean.
Final Thoughts
In most cases, you’d only want to calculate the sample standard deviation. However, although you lose some accuracy, you don’t need to look at every member of the population to get accurate results.
Be sure to try one of the methods listed above! Using an standard deviation calculator is the simplest way to calculate.
If you’re looking to boost your survey responses and create pleasant experiences, take the conversational way and try SurveySparrow today!
Have you got any questions on calculating standard deviation? Do you have any tips or hacks for calculating standard deviation? Let us know in the comment section below.
Are you looking for a survey platform that makes it easy and effective to conduct warm, conversational surveys? Wondering whether SurveySparrow is the right fit for creating and distributing your surveys? Reach out to us for a free, personalized demo!
Watch Customer Stories


