Survey & Feedback
Perceptual Map: Definition, Types, Examples & How to Create One
Discover how perceptual mapping reveals customer insights, helping businesses understand brand positioning, identify market gaps, and develop targeted strategies for product and marketing success.

TRUSTED BY BEST-IN-CLASS BRANDS


Watch Customer Stories

A perceptual map is a visual tool that shows how consumers perceive your brand relative to competitors. It plots those perceptions on a two-dimensional chart across attributes (price, quality, innovation, ease of use) that matter to your target market, giving you a clear picture of where you stand and where the gaps are.
- What is a perceptual map?
- Why your business needs perceptual maps
- 4 Steps to generate a brand perceptual map from survey data
- Two common types of perceptual mapping
- Benefits of perceptual mapping
- Four perceptual map examples
What is a Perceptual Map?
A perceptual map is a visual representation of what customers think about a product/service across various attributes like the price and ease of use. Aside from just the offerings, it can also map what they think about other brands, even the competitors, and their products.
It is plotted across an X and a Y-axis with opposing attributes to understand how consumers perceive a brand.
Perceptual mapping uses customer data to build a viewpoint on where different brands and their products stand within the overall ecosystem.
A perceptual map isn’t the same as a positioning map. Instead, perceptual mapping measures customer perception, while positioning maps compare the actual traits of a company and its offerings.
Moreover, customer perception might be right or wrong. Great marketing can easily influence it. But positioning maps only capture and compare reality.
Why Does Your Business Need Perceptual Mapping
Perceptual mapping gives you an overview of how your brand is seen across attributes. Here is what perceptual mapping helps you do.
- Find your competitive position. See exactly where your brand stands in your audience's minds relative to competitors.
- Spot market gaps. Identify areas where customer needs are unmet — these are your opportunities for new products or repositioning.
- Improve your offerings. Understand which attributes matter most to consumers and use that to guide product development.
- Sharpen your marketing. Know which perceptions to reinforce and which ones to correct before you spend on campaigns.
- Track changes over time. Monitor how perceptions shift in response to your marketing efforts and competitor activity.
How to Create a Perceptual Map
Here is a four-step process to make a perceptual map.
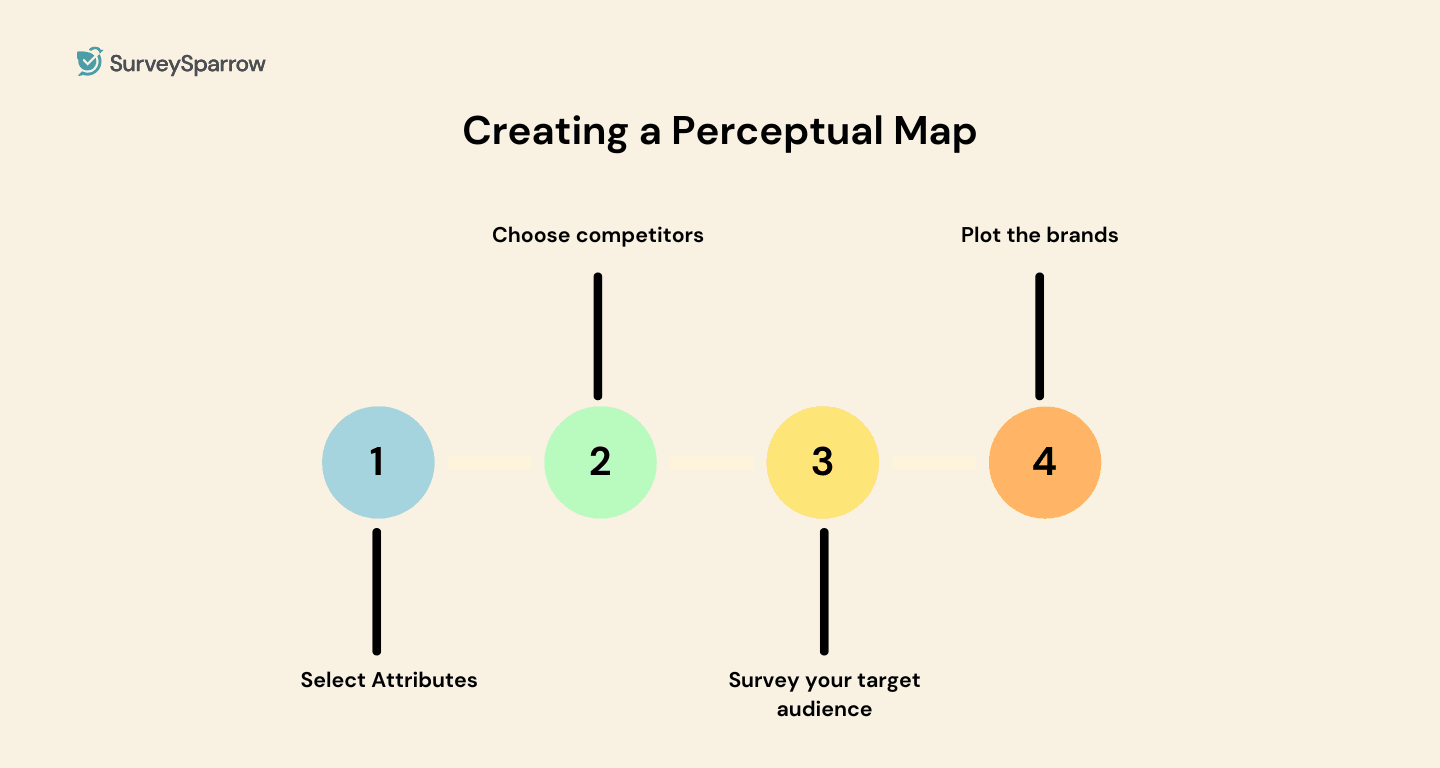
- Pick the attributes
- Choose competitors
- Survey your target audience
- Plot the brands
Step 1: Pick the attributes
Selecting attributes is the first and probably the most integral step for any perceptual map. Attributes are the things that matter to your target audience when they're comparing your brand with competitors.
Their perceptions might not be highly logical, but remember, this is a perceptual map, not positioning, so their thinking matters the most. Depending on the purpose of your map, these attributes change, and it’s always good to use those that are important from an average customer’s point of view, as they cover a wide range of your target market.
Common attribute pairs include:
Price vs. Quality
Traditional vs. Innovative
Practical vs. Luxurious
Simple vs. Feature-rich
For example, if you want to develop a perceptual map for a camera, the lens quality, zoom, ease of use, or total memory could be the prime attributes. Similarly, for shoes, it could be comfort, design, or durability, out of which you could select any two.
When you're mapping them, they need to have opposing values.
For the price, you'll map out 'high price' vs 'low price' across opposing vertices of an axis.
For quality, you can map out 'good quality' vs 'poor quality'.
Step 2: Choose competitors
Select the brands or products you want to plot. These can be direct competitors, indirect alternatives, or different products within your own range. The goal is to include enough options to make the competitive picture meaningful — typically between five and ten.
Once you've figured out your competition, you'll need to place each brand according to how consumer's perceive them. Before that, you'll need to do some research.
Step 3: Survey your target audience
Survey your target audience on how they perceive each brand across different attributes. For this, you can create a free survey using Google Forms.
Since there are many attributes, you can use this type of survey question, a matrix-question. It'll be easier to look at it at a glance and fill it up.
You can also use this brand perception survey to obtain the required information.
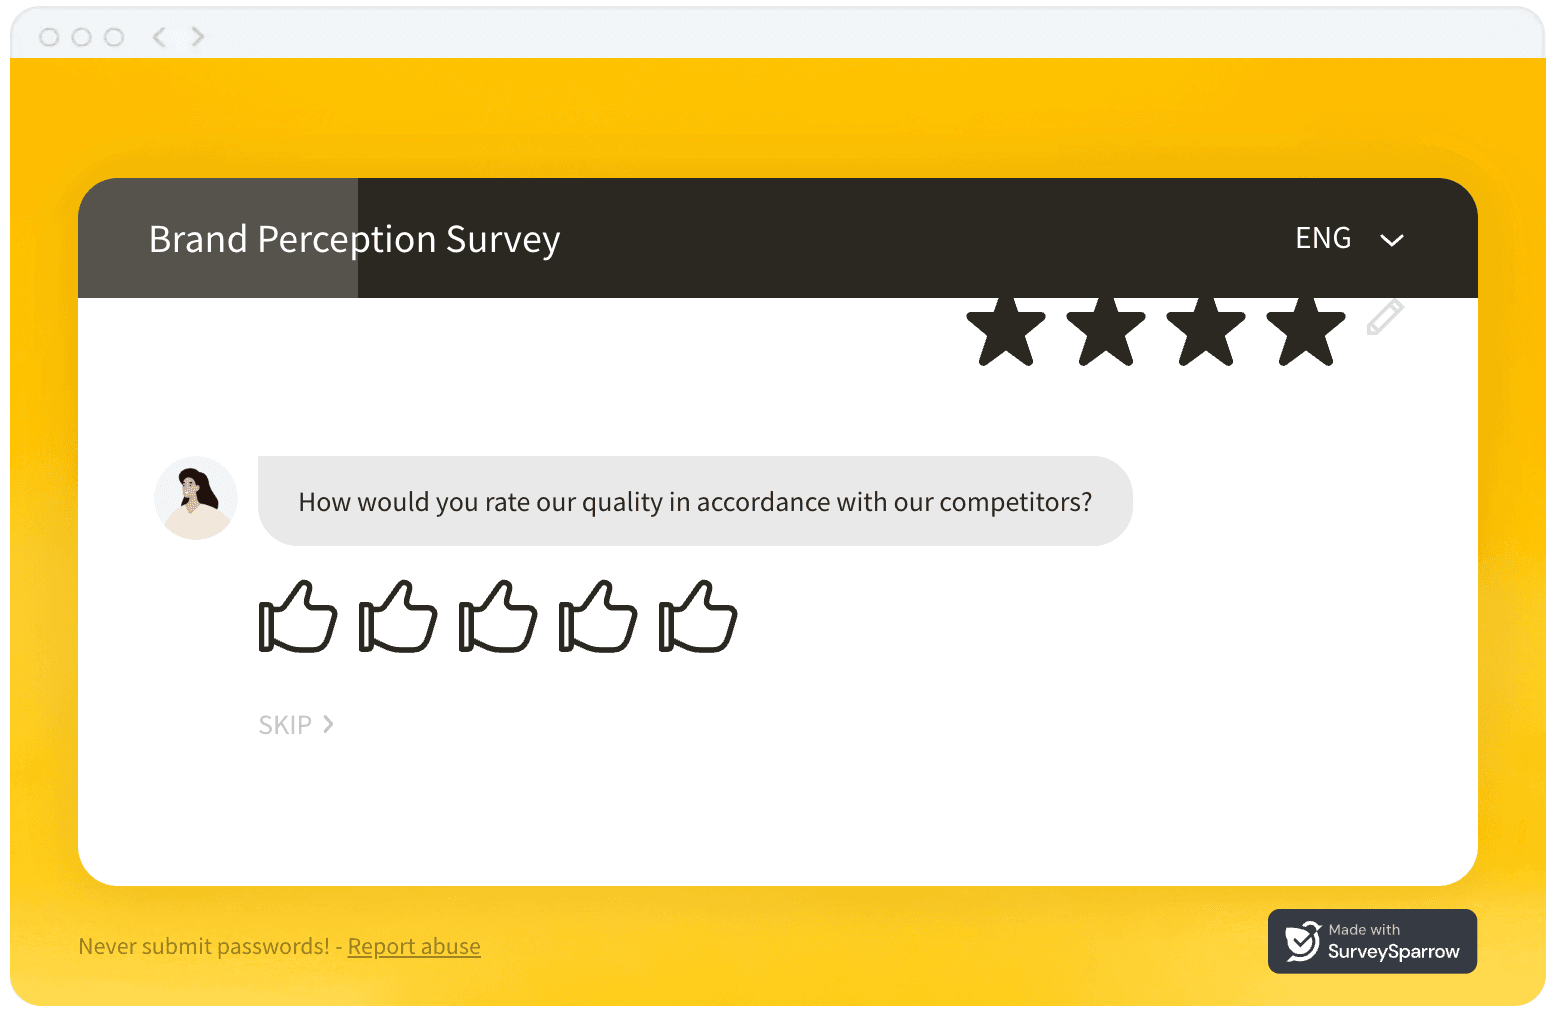
The survey building process is as simple as it can get with SurveySparrow, which allows you to get to the analysis and actual mapping stage faster. Moreover, you can create a survey in seconds using SurveySparrow's new Wing AI assistant.
Conducting focus groups is another good way to collect data on their perceptions.
Step 4: Plot the brands
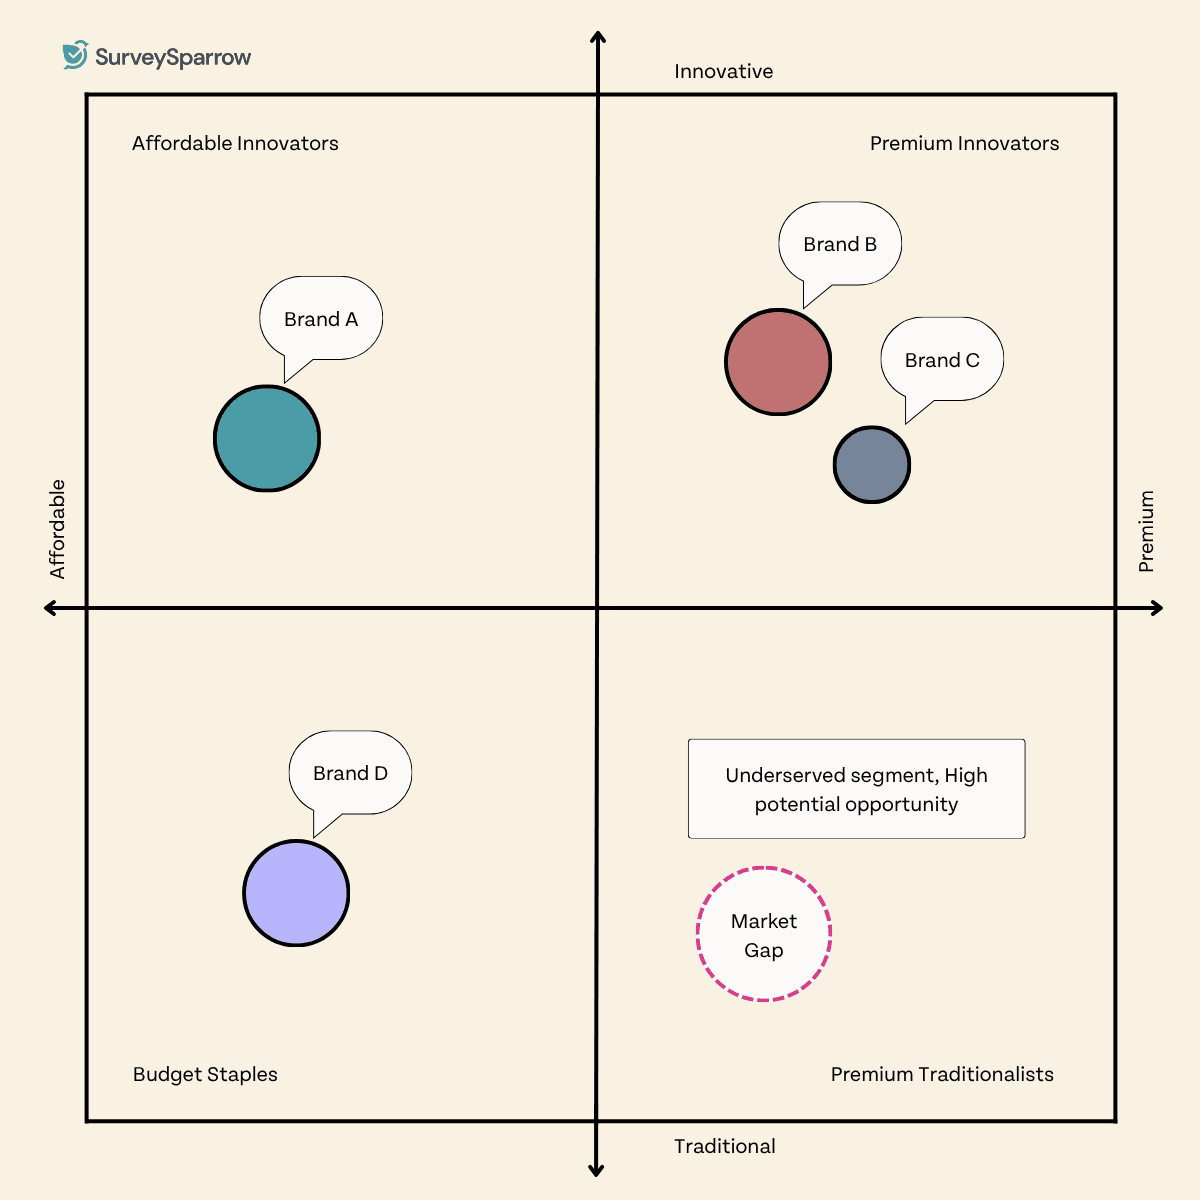
Plot your results on a two-axis chart. The X-axis represents one attribute, the Y-axis represents the other, and each brand or product gets a single point based on its average scores. The resulting map shows you at a glance how each option is perceived relative to the others — and where the white space is.
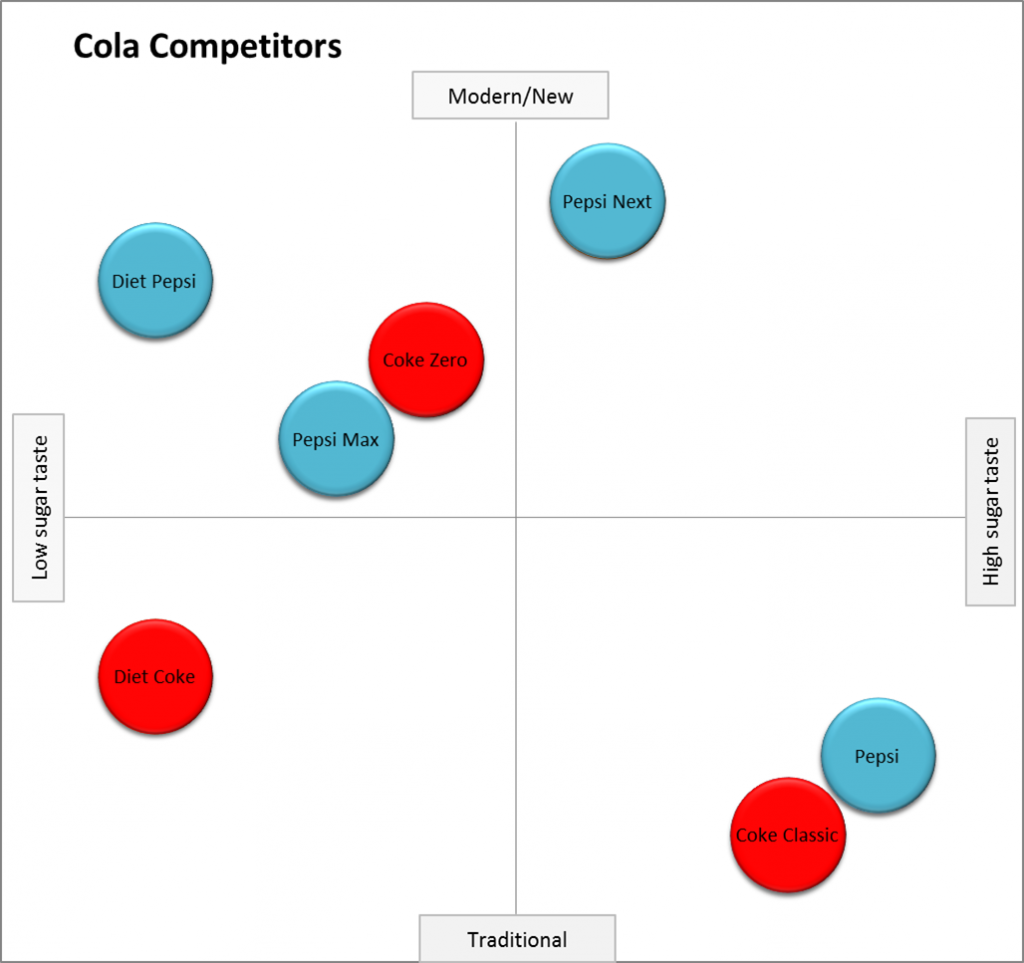
For example, here is an example of a perceptual map displaying attributes: premium vs affordable and innovative vs traditional.
If you are looking into identifying what’s working best (or worst) for your business, then SurveySparrow can help you with it.
SurveySparrow uses advanced NLP and statistical techniques to make sense of your customer (unstructured) data. These are usually open-ended questions that are difficult to analyze – not for SurveySparrow.
You can eliminate the guesswork out of the game and look into specific areas in your business. The following is an example of how SurveySparrow uses perceptual mapping in its key driver analysis.
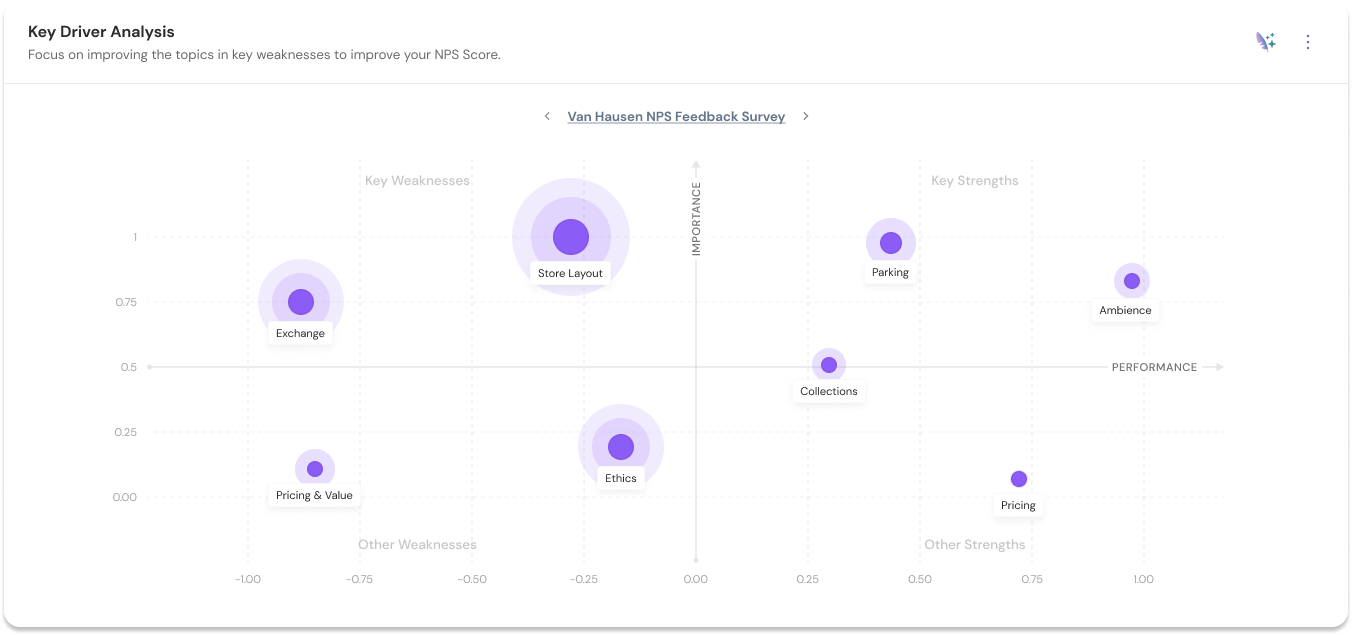
It clearly depicts your business’s strengths and weaknesses in a perceptual map. This allows for a quick understanding of what’s working best for you and worst for you.

2 Common Types Of Perceptual Maps
Perceptual maps come in two forms. The right one depends on the scale of your research and the depth of insight you need.
1. Standard Perceptual Map
The standard perceptual map has two-axis and visualizes collected data to communicate key findings. In other words, a standard perceptual map highlights the key findings from a survey quickly with minimum hassle.
2. Multi-Dimensional Scaled Perceptual Map
A multi-dimensional scaled perceptual map goes beyond two axes to present a broader analysis of the marketplace. It uses statistical tools to factor in more variables simultaneously, producing a richer but more complex output. It requires someone with the expertise to build and interpret it correctly. Use it for large-scale research where two attributes are not enough to capture the full competitive picture.
What are the benefits of using a perceptual map?
Perceptual maps turn customer opinion into a visual, actionable format. Here is what that gives you in practice:
- A clear read on customer perception. You see exactly how your target audience views your brand — not how you assume they do.
- Attribute importance. The map shows not just where brands sit, but how much the chosen attributes matter to your customers in the first place.
- A honest look at the competition. You see where competitors are outperforming you and on which specific attributes.
- Brand identity validation. You can verify whether the identity you are trying to project is actually landing with your audience.
- Market gap identification. Unoccupied areas on the map represent unmet customer needs — potential opportunities for new products or repositioning.
- Sharper marketing and sales strategies. Decisions on messaging, positioning, and campaign focus become grounded in data rather than assumption.
- A view of how the market is evolving. Running the same map at regular intervals shows you how perceptions shift over time and whether your positioning is holding.
4 simple examples of a perceptual map
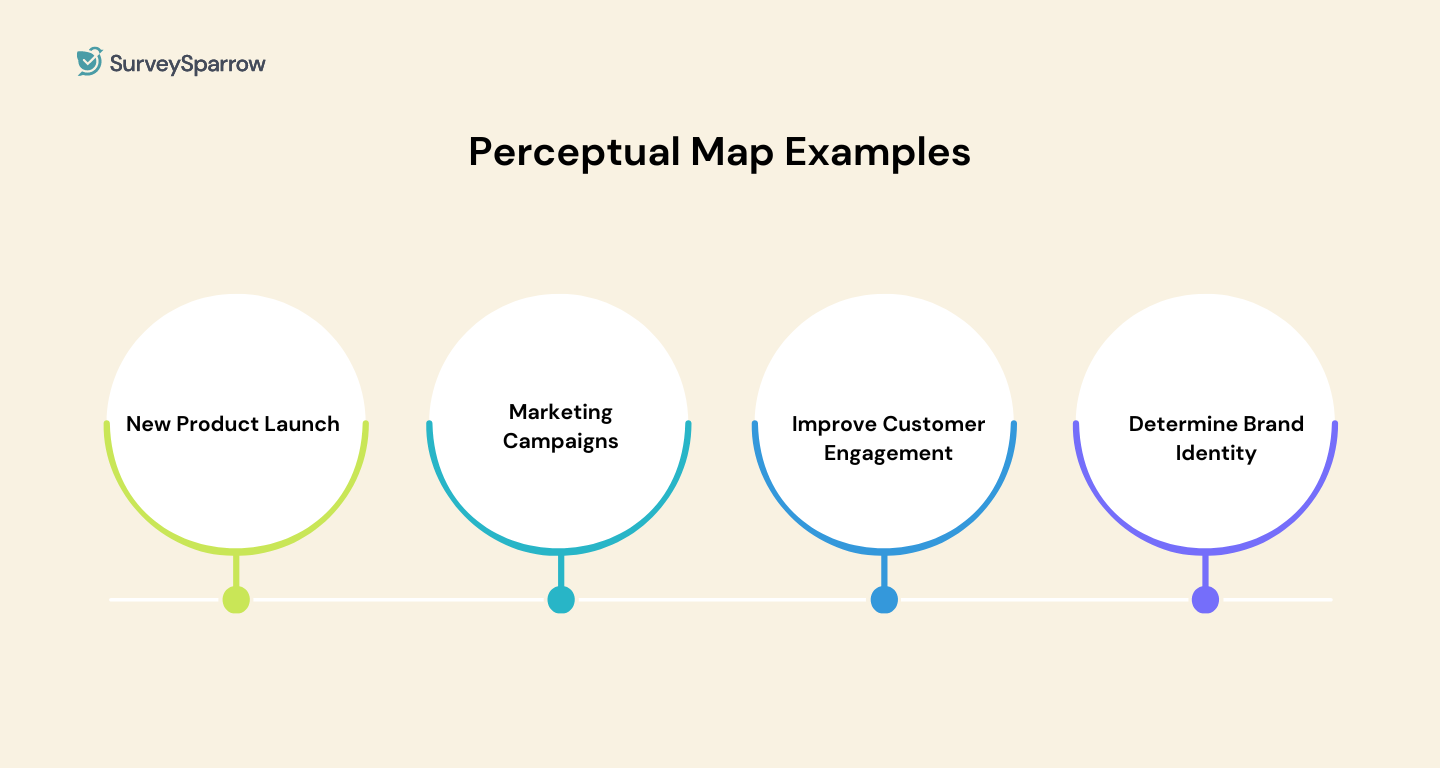
We’re familiar the definition. Now, let’s see some examples where perceptual maps are commonly used.
Perceptual mapping does a great job of finding customer perspectives for two unique attributes. But where are these maps used, and why?
1. During a new product launch
Perceptual maps help managers identify market space where new products can be launched. How? They analyze gaps in the map where it’s clear the target market isn’t satisfied with the current line of products.
As you’ll see, these gaps will determine the degree to which a new product successfully satisfies the two chosen attributes. Identifying features that aren’t working also becomes clear while analyzing perceptual maps.
The best part? As a decision-maker, you’re seeing everything from the eyes of the customer. So, if they like a specific feature of your competitor’s product, you’ll know it from the map, which will then allow you to improve yours. So, perceptual mapping provides evidence for launching a new product or bringing the needed changes.
2. Marketing campaigns
This is where perceptual maps are used the most. Online or offline marketing campaigns work best when your team understands what customers like and dislike. That’s why terms like ‘perceptual map marketing’ are gaining popularity
Customer perception weighs in gold for any marketing team. So, marketers get to know what customers are thinking about both your and your competitor’s products. This helps bring more effectiveness to their campaigns, improving the chances of success.
Even finding the most liked campaign becomes easy with perceptual maps. Of course, the quality of collected data should be high for these maps to tell the right story, but look at the ROI it’s giving to the marketing team.
3. Improving customer engagement
Your customer support team also needs support! We often forget that and focus on other business vertices, but your support team also needs to know where customers engage when they’re online? What type of support are they liking? And what’s there to improve?
These questions are answered using the correct variables with perceptual maps. And when the nature of customer engagement is explicit, the support team can make changes to attain customer satisfaction and make them loyal followers of your brand.
Sales!
Perceptual maps play a pivotal role for your sales team by narrowing down the most critical variables for the target market. This helps representatives talk in a focused way, addressing the pain points during sales calls.
Perceptual region maps also allow managers to develop strategies that can bring more sales. They focus on what matters to the target group rather than focusing on what matters to them. A tremendous shift in mentality and a perceptual map is very much the reason.
4. Determining a Brand's identity
“What do our customers think about our brand? What’s our identity in their minds?”
If that’s your question, conduct customer surveys by selecting 2 identities representing the brand correctly and mapping the findings. A perceptual map is the best way to determine if the customers have the proper brand identity in mind. If not, steps can be taken to correct that quickly.
Stay ahead of your competition
Perceptual maps are only as good as the data behind them. When your survey data is accurate and your attributes are chosen well, the map gives you a reliable picture of where your brand stands and where the opportunities are.
SurveySparrow makes the data collection straightforward. Use it to build and distribute your brand perception surveys, collect scale-based responses at scale, and feed clean data directly into your mapping process.

Understand what your competitors are doing right, where they're falling short, and how you can outperform them.

Get the full picture of where you stand in the market.
TRUSTED BY BEST-IN-CLASS BRANDS
Watch Customer Stories