Statistical Treatment of Data for Survey: The Right Approach

Vishak V
Last Updated: 1 December 2024
4 min read

Statistical treatment of data is a process used to convert raw data into something interpretable. This process is essential because it allows businesses to make better decisions based on customer feedback.
This blog post will give a short overview of the statistical treatment of data and how it can be used to improve your business.
What Exactly is Statistical Treatment?
In its simplest form, statistical treatment of data is taking raw data and turning it into something that can be interpreted and used to make decisions.
This process is important for businesses because it allows them to take customer feedback and turn it into actionable insights. There are many different statistical data treatment methods, but the most common are surveys and polls.
Surveys are a great way to collect large amounts of customer data, but they can be time-consuming and expensive to administer. Polls are a quicker and more efficient way to collect data, but they typically have a smaller sample size.
Statistical Methods for Surveys
These are the types statistical treatment of data for survey, and how they can help improve your customer feedback program.
#1. Descriptive Statistics
Descriptive statistics are used to describe the overall characteristics of a dataset. This includes measures of central tendency (mean, median, mode) and dispersion (range, variance, standard deviation).
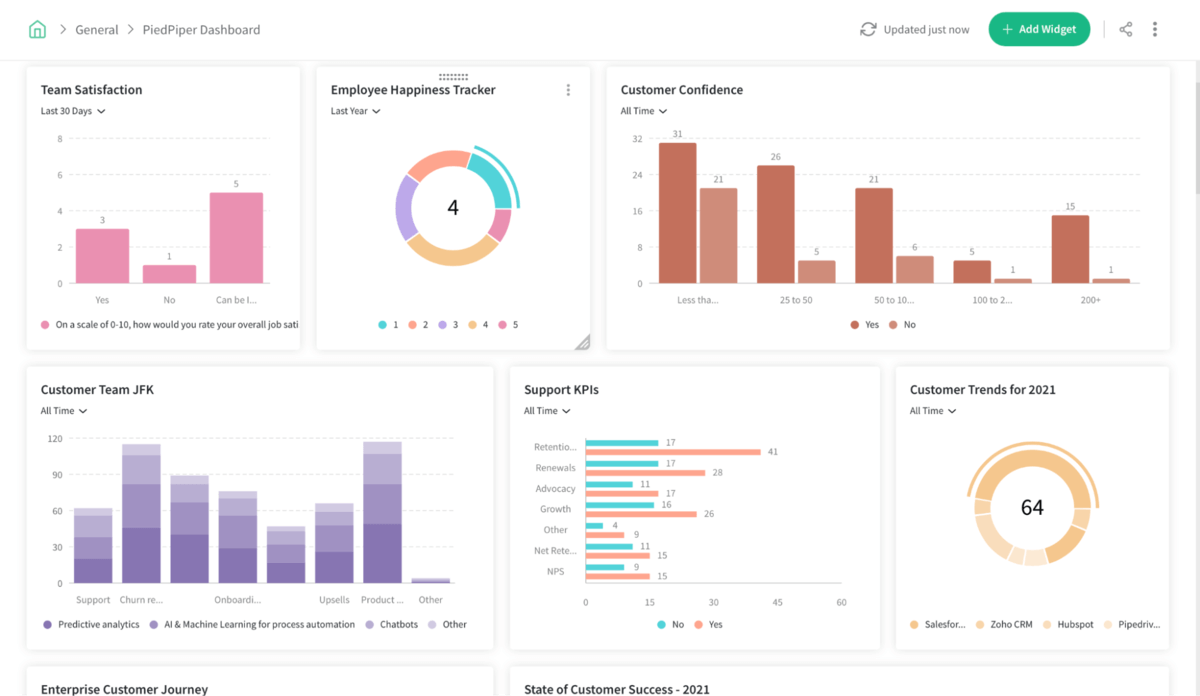
Descriptive statistics can be used to generate summary reports of survey data. These reports can be used to understand responses’ distribution and identify outliers.
Here’s how you can generate a detailed summary of survey data using SurveySparrow.

To create similar dashboards for effortless statistical analysis, sign up below for free!
Explore Deeper Customer Insights with SurveySparrow
Try it for Free!
14-Day-Free Trial • Cancel Anytime • No Credit Card Required • Need a Demo?
#2. Inferential Statistics
Inferential statistics are used to make predictions or inferences about a population based on a sample. This is done by using estimation methods (point estimates and confidence intervals) and testing methods (hypothesis testing).
Inferential statistics can be used to understand how likely it is that a particular population characteristic is true. For example, inferential statistics can be used to calculate the probability that a customer will be satisfied with a product or service.
Once you have collected your data, the next step is to choose a statistical analysis method. The most common methods are regression, correlation, and factor analysis.
#3. Regression Analysis
Regression analysis is a method used to identify the relationships between different variables.
For example, you could use regression analysis to understand how customer satisfaction ratings change based on the number of support tickets they open.
#4. Correlation Analysis
Correlation analysis is a method used to understand how two variables relate.
For example, you could use correlation analysis to understand how customer satisfaction ratings change based on the number of support tickets they open.
#5. Factor Analysis
Factor analysis is a method used to identify which variables impact a particular outcome most.
For example, you could use factor analysis to determine which factors influence customer satisfaction ratings most.
Next steps: Once you have chosen a method of statistical treatment of data, the next step is to apply it to your dataset. This step can be done using Excel or another similar program.
Once you have applied your chosen method, you can interpret the results and use them to make decisions about your business.
Wrapping Up
In short, statistical treatment of data for survey is a necessary process that allows businesses to take customer feedback and turn it into actionable insights.
There are many different statistical data treatment methods, but the most common are surveys and polls. Online survey tools like SurveySparrow can help you with the same.
Once you have collected your data, you must choose a form of statistical analysis and apply it to your dataset. You will then be able to interpret the results and use them to make decisions about your business. Thanks for reading!

Vishak V
Frustrated developer turned joyous writer.
Product Marketer

Turn every feedback into a growth opportunity
14-day free trial • Cancel Anytime • No Credit Card Required • Need a Demo?


