Revolutionize Survey Feedback with SurveySparrow's Advanced Data Analytics & Visualizations

Jaby K J
Last Updated: 31 May 2024
10 min read

Imagine a world where you can collect, analyze, and act on survey feedback from your customers with unparalleled ease and precision.
SurveySparrow, a state-of-the-art online survey platform, is here to bring that world to life with its advanced analytics and visualization capabilities. This powerful tool helps businesses unlock actionable survey reports and insights and make data-driven decisions to stay ahead of the competition.
In this blog, we will delve into the numerous exceptional features offered by SurveySparrow, such as advanced data analysis, dashboards, charts, filtering, ticket management, NPS surveys, and visualizations.
Prepare to be amazed and explore them at your own pace.
- Unleash the Power of Data Analysis
- Insights at a Glance: Dashboard and Charts
- Fine-tune Your Focus with Filtering
- Close the Feedback Loop with Ticket Management
- Measure Customer Loyalty with NPS Surveys
- The Art of Survey Data Visualization
- Final Thoughts
#1 Unleash the Power of Data Analysis
SurveySparrow’s robust data analysis tools enable you to harness the full potential of your survey feedback and insightful data. Gain a comprehensive understanding of your customers’ preferences, pain points, and satisfaction levels to enhance your products and services, boost customer retention, and skyrocket revenue growth.
By leveraging SurveySparrow’s advanced data analysis capabilities, you’ll position your business for success in a competitive landscape.
Here’s how SurveySparrow can help with insightful survey feedback:
- Break down your data: SurveySparrow allows you to segment your data by various demographic factors, such as age, gender, and location. This helps you identify trends and patterns in customer behavior, enabling you to tailor your marketing efforts for maximum impact.
- Cross-tabulation: This advanced feature lets you compare the responses to different survey questions, providing a deeper understanding of the relationships between various data points. With cross-tabulation, you can uncover hidden insights and develop targeted strategies for different customer segments.
- Real-time analysis: SurveySparrow’s real-time analytics ensure you always have up-to-date information at your fingertips. Monitor your survey feedback as they come in, and make timely adjustments to your strategies for maximum effectiveness.
14-day free trial • Cancel Anytime • No Credit Card Required • No Strings Attached
#2 Insights at a Glance: Dashboard and Charts
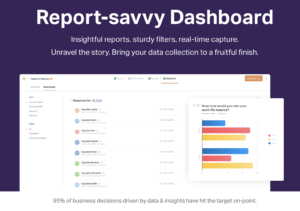
Visualize your survey feedback and final results like never before with SurveySparrow’s intuitive dashboard and customizable charts.
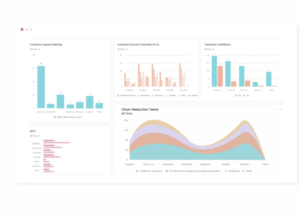
In addition, get a bird’s-eye view of your data, enabling you to identify trends and patterns quickly. You can also display your survey data in various formats, such as pie charts, bar graphs, and line charts, to facilitate better analysis and decision-making.

Make the best use of the dashboard’s advanced features, such as:
- Interactive dashboard: SurveySparrow’s interactive dashboard allows you to drill down into specific data points and timeframes, giving you a more granular view of your survey results. Customize your dashboard to display the most relevant information for your business, ensuring that you always have the data you need to make informed decisions.
- Exportable charts: Need to share your survey results with your team or stakeholders? No problem! SurveySparrow’s charts can be easily exported as images or PDFs, making sharing your findings and collaborating with others simple.
- Trend analysis: Keep a close eye on how your survey results change over time with SurveySparrow’s trend analysis feature. By monitoring trends, you can quickly identify areas where your business is excelling or falling short, allowing you to adjust your strategies proactively.
#3 Fine-tune Your Focus with Filtering
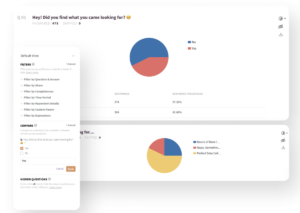
Unlock deeper insights by segmenting and focusing on specific data points using SurveySparrow’s advanced filtering options. The targeted analysis allows you to uncover hidden patterns, understand customer segments, and tailor your offerings for maximum impact.
Refrain from settling for surface-level data when you have SurveySparrow to fine-tune your focus in the best ways possible.

Let’s explore how this feature can help you tailor your offerings for maximum impact.
- Conditional filtering: Apply dependent filters to your survey data to focus on specific subsets of respondents. For example, you can filter your data to show only the responses of customers who have purchased within the past month, allowing you to analyze their feedback and identify areas for improvement.
- Multiple filters: Combine various filters to create even more targeted data segments. For instance, you can filter responses by age group and customer satisfaction rating to better understand how different age groups perceive your brand and offerings. This level of granularity can help you develop more targeted and effective marketing strategies.
- Saved filters: Save time and effort by creating and saving custom filters for future use. With saved filters, you can quickly apply the same conditions to your survey data whenever necessary, making your analysis process more efficient and consistent.
#4 Close the Feedback Loop with Ticket Management
Build lasting relationships with your customers by effectively managing their feedback. SurveySparrow’s ticket management feature helps you track, prioritize, and resolve customer issues, ensuring that their concerns are addressed promptly.
Get to know how automated ticket generation and intelligent routing can enhance your customer’s experience and increase their loyalty to your brand. Furthermore, here’s how SurveySparrow’s ticket management feature can help you track, prioritize, and resolve customer issues.
- Automated ticket generation: SurveySparrow automatically creates tickets for customer issues identified through survey responses. This streamlines your feedback management process and ensures no customer concerns fall through the cracks.
- Smart routing: Assign tickets to the appropriate team members or departments based on predefined rules. This ensures that customer issues are handled by the right people, leading to faster resolution times and improved customer satisfaction.
- Tracking and prioritization: Keep track of your tickets’ status and prioritize them based on factors such as urgency, impact, and customer segment. This helps you focus your efforts on the most critical issues and drive continuous improvement across your organization.
#5 Measure Customer Loyalty with NPS Surveys
Research conducted by Baquero, A. on the topic “Net Promoter Score (NPS) and Customer Satisfaction: Relationship and Efficient Management Sustainability” found that NPS is strongly associated with other customer satisfaction metrics and has predictive power for future customer behavior.
The main inference of this study is that there is a strong correlation between Net Promoter Score (NPS) and customer satisfaction, indicating that a higher NPS is associated with increased satisfaction levels among customers.
And with SurveySparrow’s Net Promoter Score (NPS) surveys, you can achieve customer loyalty and satisfaction. Your NPS score can also be tracked over time, identifying promoters and detractors and gathering valuable feedback.
Tap into the power of NPS surveys to better understand your customer’s needs and expectations, ultimately leading to increased loyalty and business growth. Here’s how SurveySparrow’s NPS surveys can help you measure and improve customer loyalty.
- Benchmarking: Compare your NPS score against industry benchmarks to understand how your business stacks up against competitors. By identifying areas where your brand excels or lags, you can develop targeted strategies for improvement.
- Follow-up questions: SurveySparrow’s NPS surveys allow you to ask follow-up questions to gain more detailed feedback from your customers. Use this additional information to pinpoint specific issues or opportunities for growth, helping you make more informed decisions.
- Segmentation: Analyze your NPS data by various customer segments, such as demographics or purchase history, to better understand how different customer groups perceive your brand. This information can help you tailor your marketing and customer service efforts better to meet the needs of your diverse customer base.
#6 The Art of Survey Data Visualization
Transform your survey feedback into visually appealing and easy-to-understand formats with SurveySparrow’s data visualizations.
Choose from various options, such as word clouds, heatmaps, and trend analysis, to communicate your findings effectively to team members, stakeholders, and decision-makers.

- Word clouds: Visualize open-ended responses in a dynamic and engaging format with word clouds. Word clouds highlight the most frequently mentioned words or phrases, making identifying common themes and trends in your customers’ feedback easy.
- Heatmaps: Use heatmaps to display the distribution of responses across various answer choices or rating scales. Heatmaps can help you quickly identify areas of consensus or disagreement among your respondents, allowing you to make more informed decisions.
- Geographic visualizations: Display your survey data on an interactive map to gain insights into geographic trends and patterns. This can be particularly useful for businesses with a global or regional focus, as it allows you to tailor your strategies to different markets’ unique needs and preferences.
Final Thoughts
Now that you know various out-of-the-world features to make your survey feedback more exclusive, it’s time you empower your business with the advanced analytics and visualizations offered by SurveySparrow.
Experience a seamless feedback process, from data collection to analysis and action, all within a single platform. This way, you can elevate your business to new heights by unlocking actionable insights with SurveySparrow’s state-of-the-art tools.
So, no more gathering mediocre feedback. Now you get to make it more innovative with SurveySparrow seamlessly. Experience firsthand how SurveySparrow’s cutting-edge platform can revolutionize your approach to customer feedback and set you on the path to long-term success.

Jaby K J
Growth Marketer at SurveySparrow
Passionate, eidetic, and a writer at large.
You Might Also Like

Brand Experience
12 Top AI Conversational Platforms For 2024

Survey Tips
Why is everyone talking about closed loop feedback system? Why you should too!

Customer Experience
Top 10 Podium Alternatives | Reputation Management Software

Best Of
Employee Performance: 30 Helpful Techniques to Boost It in 2024 and Beyond

Turn every feedback into a growth opportunity
14-day free trial • Cancel Anytime • No Credit Card Required • Need a Demo?
