Customer Experience
How to Measure Customer Experience: A Complete Guide
Unlock powerful customer experience measurement strategies with key metrics like NPS, CSAT, and CES to transform customer insights and drive business growth through data-driven improvements.

TRUSTED BY BEST-IN-CLASS BRANDS


Watch Customer Stories
Measuring Customer Experience is key to enhancing customer satisfaction and building long-lasting relationships with your target audience.
Every interaction a customer has with your brand contributes to their overall perception of your business. From their first encounter to ongoing interactions and support, CX shapes their loyalty and advocacy.
How can you gauge the quality of these experiences? How do you effectively measure it? Which metrics should you track?
Fret not! We will delve into the details and provide valuable insights, strategies, and tools to boost your CX game!
Off we go!
Understanding Customer Experience Measurement
Before we deal with that, let’s first look at a very important question.
What is Customer Experience?
Customer experience (CX) encompasses every touchpoint a customer has with your brand, including their emotions, perceptions, and overall satisfaction. From the first website visit to post-purchase support, customer experience encompasses everything.
Measuring customer experience is, essentially, gauging and analyzing each of the elements of CX. It lets you gain valuable insights into your customers’ thoughts, sentiments, and preferences.
Collecting relevant data and utilizing appropriate metrics allows you to evaluate your CX initiatives’ success and identify areas for improvement.
Having the right metrics, methods, and the perfect tools at your disposal is essential for measurement. Let’s quickly start with metrics.
Key Customer Experience Metrics
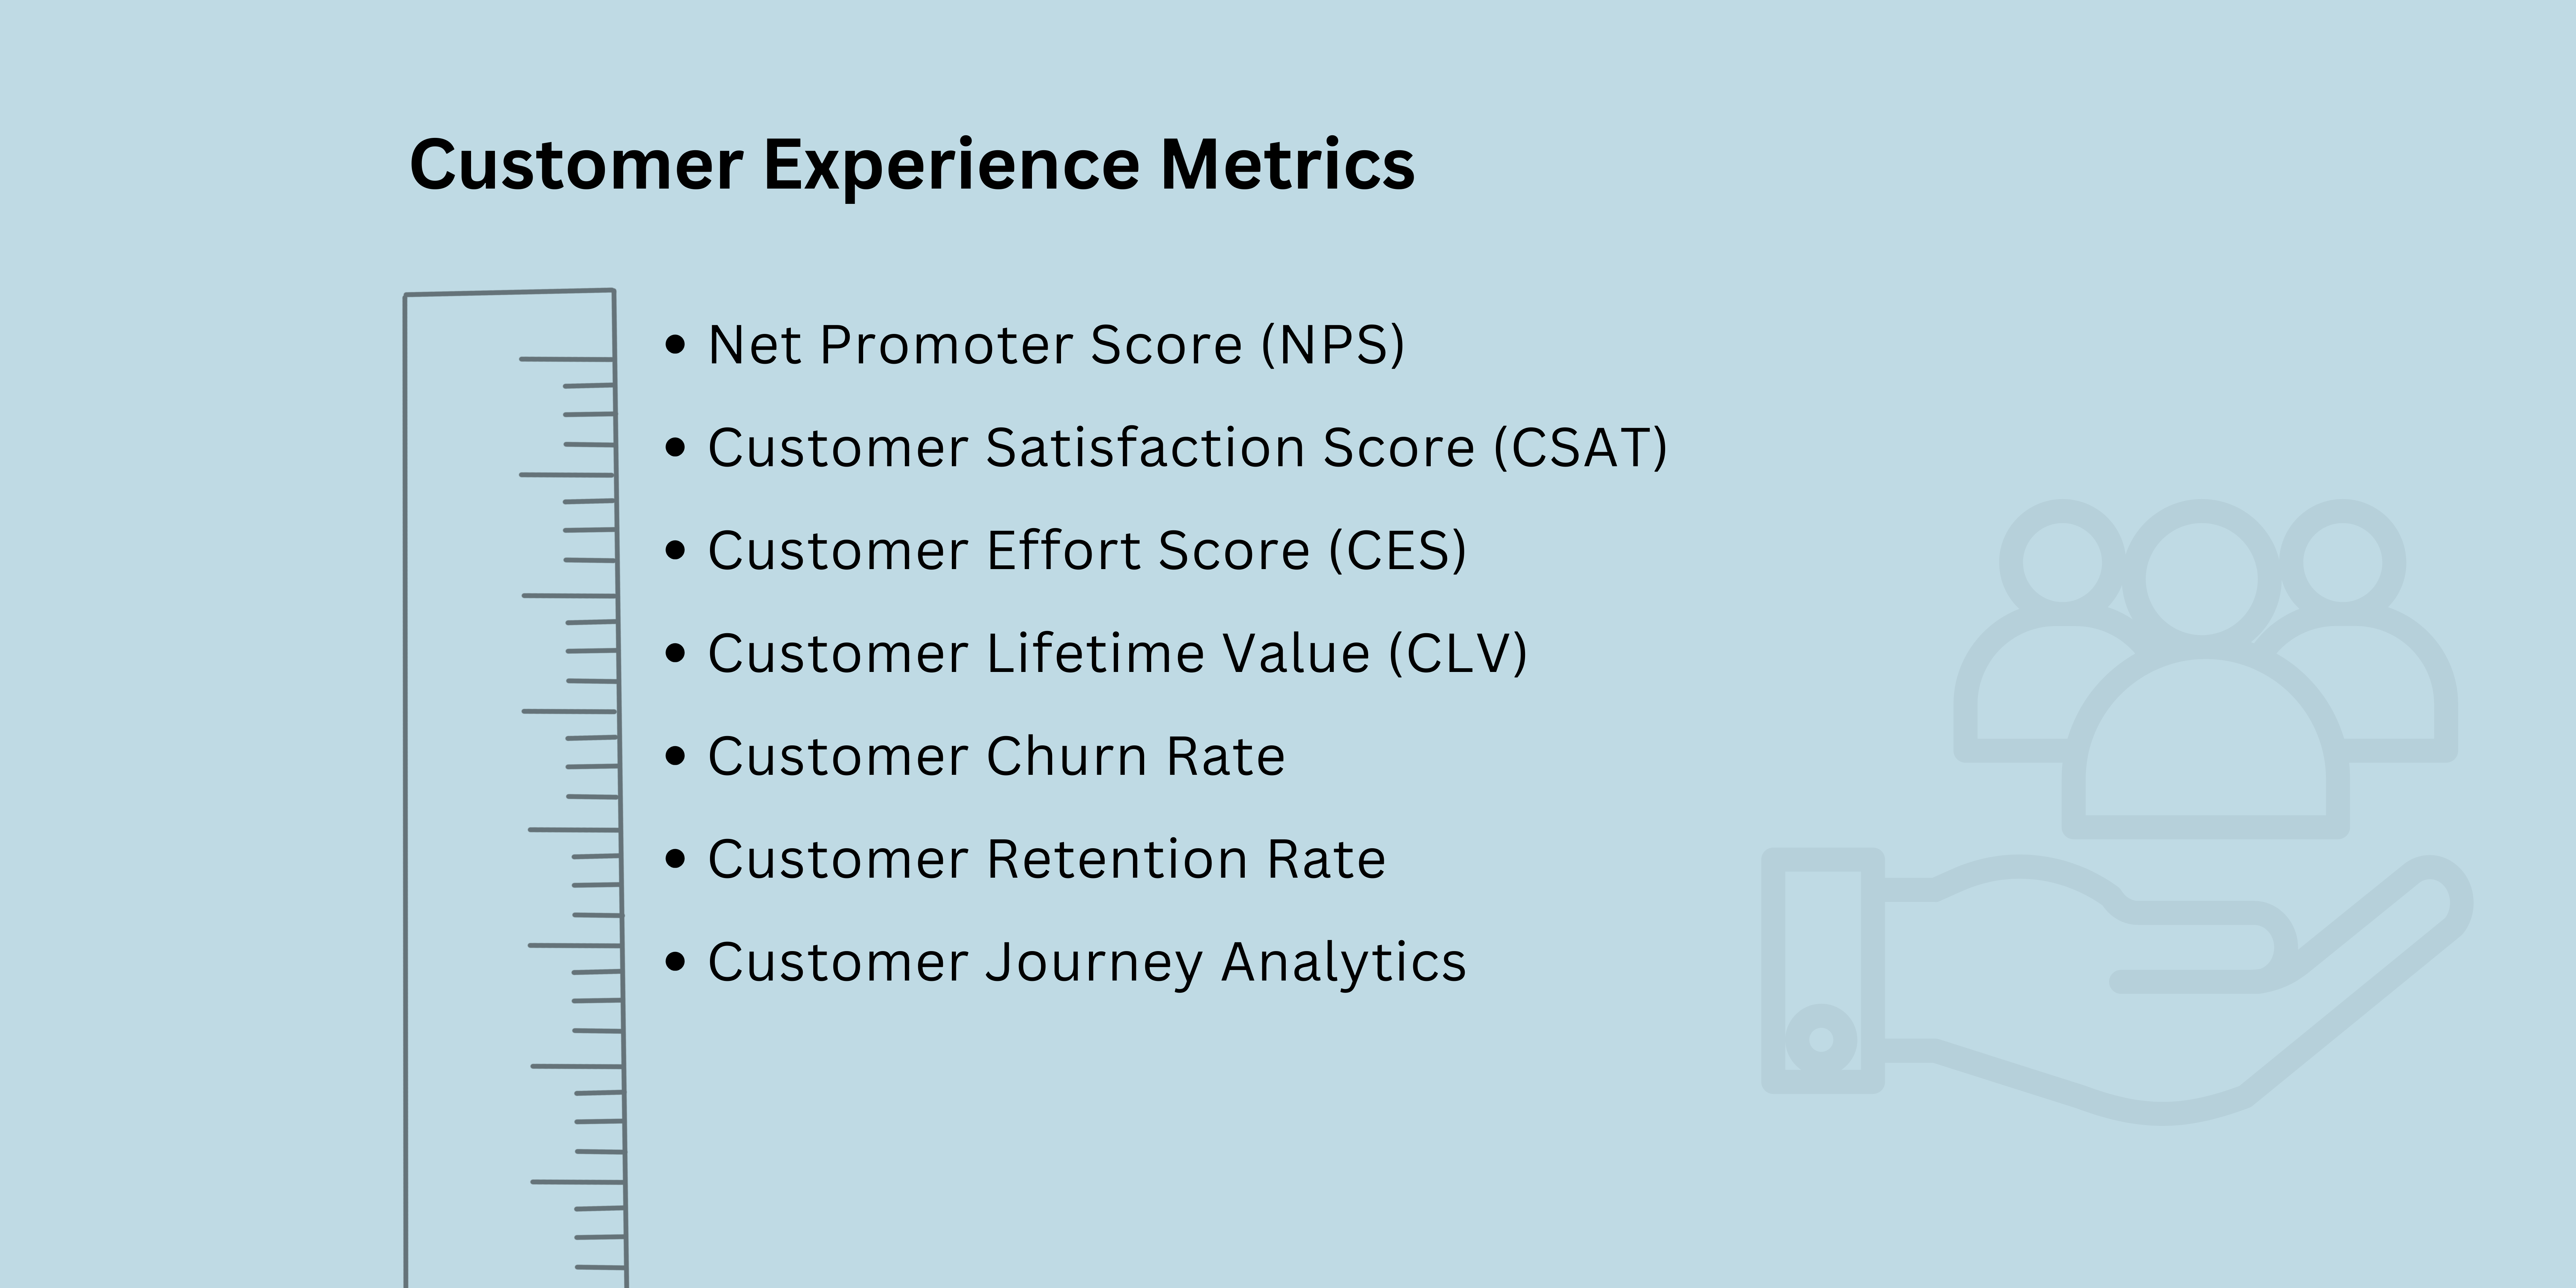
1. Net Promoter Score (NPS)
- This metric measures customer loyalty and gauges the likelihood of customers recommending your brand to others.
- NPS is derived from a simple question: “On a scale of 0-10, how likely are you to recommend our product/service to others?” By categorizing respondents into promoters, passives, and detractors, you can evaluate the overall sentiment toward your brand.
NPS = %Promoters – %Detractors
Let’s quickly take a look at the categorization:
- Promoters: These are happy customers who give scores of 9 or 10. They’re likely to tell others about the product or service.
- Passives: These customers give scores of 7 or 8. They’re satisfied but not super excited. They might recommend it, but there is also a chance that they might not.
- Detractors: This includes unhappy customers who give scores of 0 to 6. They’re not satisfied and might spread negative feedback.
Curious about what an NPS Survey looks like?
NPS Survey Template
Use This Template(Oh, and hey, feel free to customize it if you like)
Why don’t we move on to the next KPI?
2. Customer Satisfaction Score (CSAT)
- CSAT measures how satisfied customers are with a specific interaction or experience.
- It usually involves asking customers to rate their satisfaction on a scale ranging from “Very Unsatisfied” to “Very Satisfied.” CSAT provides insights into the effectiveness of individual touchpoints and helps identify areas that require improvement.
CSAT = (Sum of Positive Responses / Total Responses) x 100
3. Customer Effort Score (CES)
- CES assesses the ease or difficulty of a customer’s experience with your brand.
- By asking customers to rate the effort required to accomplish a particular task or resolve an issue, you can identify pain points and streamline processes to reduce customer effort.
CES = (Sum of Effort Scores / Total Responses) x 100
4. Customer Lifetime Value (CLV)
- CLV is like a crystal ball that predicts the net profit a customer will generate throughout their entire relationship with your business.
- It goes beyond the initial transaction and considers the value derived from repeat purchases, upsells, and referrals.
CLV = (Average Purchase Value) x (Average Purchase Frequency) x (Customer life span)
Calculation: CLV = (Average Purchase Value) x (Average Purchase Frequency) x (Customer life span)
5. Customer Churn Rate
- It refers to the percentage of customers who stop doing business with you within a specific period.
- It tells you how well you’re keeping customers engaged and satisfied.
- By identifying the reasons behind customer churn, such as poor product quality, subpar customer service, or competitive offers, you can take proactive steps to address those issues and improve customer retention.
Churn Rate = (Number of Customers Lost / Total Number of Customers) x 100
6. Customer Retention Rate
- The CRR measures the percentage of customers you successfully retain over a specific period.
- A high retention rate indicates customer satisfaction, loyalty, and a strong relationship with your brand.
Retention Rate = {(Total Number of Customers at the End – Number of Customers Acquired) / Total Number of Customers at the Start} x 100
7. Customer Journey Analytics
- It’s the practice of analyzing and understanding the end-to-end customer journey across multiple touchpoints and channels.
- From the first point of contact to post-purchase engagement, customer journey analytics allow you to fine-tune your strategies and deliver seamless and memorable experiences.
Calculation: Analyzing customer interactions, behaviors, and preferences at each stage of their journey using data analytics tools and techniques
Now, it’s time to look at the methods of measurement. We won’t go too deep into the topic.
Methods to Measure Customer Experience
One of the go-to methods for checking in on how the customers are doing is through…
1. Surveys
Surveys are popular because of their ability to collect direct feedback from the customers. This firsthand information gives insights into satisfaction levels, pain points, and areas for improvement.
You can use NPS, CSAT, and CES surveys to measure loyalty. Moreover, they are not restricted to numbers, we can collect quantitative and qualitative data to get a comprehensive view of customer sentiments.
Now, when it comes to data collection, an advanced online survey tool will be handy. You can try using SurveySparrow if you like. You can create, collate, visualize, analyze, and make informed decisions based on the insights gained from a single platform! Curious? We’ll talk about the tool in a bit.
If you’re already familiar with the platform, what are you waiting for? Survey away!
For now, let’s look at the next important method.
2. Customer Interviews
You can set up interviews with customers for more in-depth chats about their experiences.
Interviews give you in-depth insights into the thoughts of an individual. Plus, it helps in creating a personal bond with the customer. When you have a face-to-face conversation, it is easier to get the surrounding context.
Now, whether conducted in person, over the phone, or via video conference, interviews can be tailored to meet the needs of both the interviewer and the interviewee. Hence, it is flexible.
3. Social Media Monitoring
This is more like keeping an eye on what people say about your brand, products, or services on platforms like Facebook, Twitter, and Instagram. You tune into the chatter happening online for insights!
Here’s how it works: You set up tools or systems to track mentions, comments, and reviews related to your business. Then, keep tabs on these conversations to see what people say— positive, negative, or neutral.
It helps you stay connected with your audience, address issues promptly, and engage with customers directly.
Top Customer Experience Measurement Tools
Here are two tools you should not miss:
1. SurveySparrow

SurveySparrow is an experience management platform, known for its conversational interface! It stands out for its chat-like surveys, advanced analytics, and comprehensive set of features.
You can create engaging surveys with a 40% higher response rate and share them via multiple platforms. Now, let’s look at the features that make it the best tool:
Key Features
- Conversational Interface: The user-friendly interface makes using the tool as easy as pie. Moreover, chat-like surveys create a sense of trust in the customers, leading to a higher response rate. You can use advanced features like skip and display logic to personalize the experience.
- CX Module: You get to create NPS, CSAT, and CES surveys that’ll give you a detailed understanding of customer sentiment.
- Customizable Template: There are 1000+ pre-designed survey templates in the library. You can personalize them to your liking, tweak a few questions, or remove the ones you feel don’t fit the bit. You can use the Wing Feature to edit the questions.
- AI Surveys: Well, we all feel a bit demotivated at times. Let’s admit it. At such times, enter a prompt and let AI do the magic. Plus, with the ChatGPT plugin, everything is easier.
- Ticket Management: Close the feedback loop, follow up with your customers, and channel responses into tickets.
Pricing
- A free forever plan is available
- Basic plan starts at $19 / month
Why don’t you take it for a spin today? It’s free!
2. Qualtrics XM
Qualtrics is a platform that lets you create seamless experiences for your customers. It offers a comprehensive set of tools that go beyond traditional surveys.
Key Features
- Continuous Listening: The platform lets you understand your customers deeply by keeping an eye on every movement. This helps in getting real-time analytics!
- Unified Platform: You get all CX interactions in one place.
- Mobileapp Feedback: make your customer feel valued by focusing on their feedback. With this, you can analyze gaps and improve digital CX!
Pricing
You can contact the team for a quote or request a demo
Best Practices and Strategies for Effective Customer Experience Measurement
Measuring customer experience is not just about collecting data; it’s about taking meaningful actions based on insights. Here are some best practices to ensure effective customer experience measurement:
Define Clear Objectives:
Start by defining clear objectives for your customer experience measurement efforts. What specific outcomes do you aim to achieve? Align your metrics and strategies with these objectives to drive meaningful improvements.
Capture Feedback at Key Touchpoints:
Identify the critical touchpoints in your customer journey and capture feedback at each stage. This helps you holistically understand the customer experience and identify areas requiring attention and improvement.
Act on Feedback:
Gathering feedback is only the first step. You must take action based on the insights gained to truly improve CX. Use the data to identify trends, address pain points, and implement changes that enhance customer satisfaction.
Foster a Customer-Centric Culture:
Make customer experience a priority across your organization. Encourage all employees to contribute to improving customer experiences and empower them to take ownership of the customer journey.
Visual Suggestion:
Insert a table listing different customer experience strategies and the corresponding metrics they align with, and highlight the importance of taking action based on the metrics.
Conclusion
So, to wrap it up, customer experience measurement is crucial for businesses. It helps them understand how customers perceive their brand and interactions. By using metrics and analyzing the customer journey, companies can identify areas for improvement and enhance customer satisfaction and loyalty.
But it doesn’t stop there. It’s essential to have a solid strategy in place, with thoughtful design, empowered employees, and the ability to measure results. These pillars of success ensure that businesses can continually improve and adapt to meet customer needs.
So, whether you’re a small startup or a large corporation, investing in customer experience measurement is vital. It’s about putting your customers at the center of everything you do and creating experiences they’ll remember and cherish. By doing so, you’ll not only drive growth but also build long-term relationships with your customers.
FAQs
Q1. What are the six dimensions of customer experience?
- Reliability (consistency and dependability)
- Responsiveness (timeliness and willingness to help)
- Assurance (competence and credibility),
- Empathy (understanding and caring)
- Tangibles (physical and digital elements)
- Personalization (tailoring experiences to individual needs)
Q2. What are the three main components of customer experience?
- Customer Journey (the end-to-end process a customer goes through)
- Touch Points (interactions between the customer and the business)
- Customer Emotions (the feelings and reactions evoked during the experience)
Q3. What are the five modes of customer experience?
- Buy (the process of purchasing a product or service)
- Own (the post-purchase stage of ownership)
- Use (the actual utilization of the product or service)
- Ask (interactions with customer support or seeking information)
- Advocate (recommendation and sharing positive experiences with others)
Q4. What are the four pillars of the essential customer experience?
- Strategy (aligning business goals with customer needs)
- Design (creating intentional and seamless experiences)
- Enable (empowering employees to deliver exceptional experiences)
- Measure (tracking and analyzing key metrics to monitor and improve customer experience)
Watch Customer Stories


")


