Survey & Feedback
Factor Analysis: Definition, Types, and Best Practices
Article written by Kate Williams
Content Marketer at SurveySparrow
11 min read
19 September 2025

60-Second Summary:
Factor analysis is a statistical technique that helps simplify complex data by grouping many variables into fewer underlying factors. For example, it can reveal that questions about product quality and durability all relate to a single factor like “product reliability.”
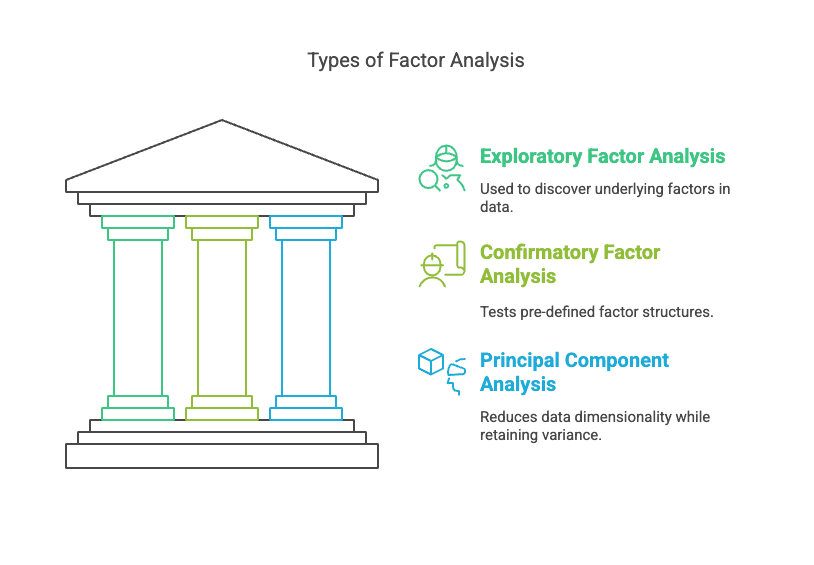
There are 3 common types:
Exploratory Factor Analysis (EFA), Confirmatory Factor Analysis (CFA) and Principal Component Analysis (PCA)
Why Use It?
- Identify hidden patterns.
- Make smarter, data-driven decisions.
- Save time by focusing on key insights.
- Predict trends and validate hypotheses.
In short, factor analysis turns complex data into clear insights, helping businesses and researchers understand what truly drives behaviors and preferences.
Are you someone who loves to get lost in the maze of numbers, or are you like me, who wonders (daily!) how experts make sense of the chaos? If you’re the former, you might have heard about factorial analysis and might be here for the thrill of it. But if you’re the latter, worry not; I was there once too.
This blog will deal with all that you need to know about factor analysis: meaning, types, how to conduct it, and even the best practices you need to follow!
What is Factor Analysis?
Factor analysis is a statistical method used to identify patterns and relationships within a set of variables. It reduces a larger set of variables into a smaller set of factors that capture the essential information.
To put it simply, factor analysis explores how multiple variables interact, helping researchers understand underlying relationships between factors. Take a survey with multiple questions. Each question becomes a factor. Factor analysis dissects them, revealing hidden connections and providing valuable insights.
For example, imagine you’re analyzing customer satisfaction surveys. Factor analysis might reveal that questions about product quality, durability, and performance all measure one underlying factor: “product reliability.” Similarly, questions about staff friendliness, helpfulness, and knowledge might measure another factor: “service quality.”
So, what does factor analysis do? It simplifies vast datasets into manageable, meaningful factors!
What is a Factor?
Let’s begin with the basic terminology, shall we?
Imagine you’re conducting market research on the smartphone preferences of a population varying in age. While you’re trying to get a hang of it, there might be many features you’ll go through in detail, right? It could be the cost, the brand, or maybe even its camera quality. These features are called factors in research, and they help you understand customer preferences.
These factors aren’t arbitrary, though. They are variables that affect customers’ buying behavior. Researchers meticulously select them based on hypotheses and existing knowledge about the market. For instance, a factor like brand reputation could be divided into levels such as “established brands,” “emerging brands,” and “local manufacturers.” Each level represents a segment of the market and a unique factor influencing consumer decisions.
Types of Factor Analysis
Factor analysis comes in various forms. The three most common types are:
Exploratory Factor Analysis (EFA)
Exploratory factor analysis (EFA) is used when researchers don’t have preconceived ideas about the underlying structure of the data. It’s like exploring uncharted territory, letting the data reveal its own patterns and relationships.
Key characteristics of EFA include:
No predetermined structure or hypothesis
Data-driven approach that reveals underlying patterns
Helps identify how many factors exist in the data
Useful in the early stages of research or instrument development
For example, a researcher developing a new personality assessment might use EFA to discover which of their 50 questions cluster together, which might potentially reveal the major personality dimensions their test measures.
Confirmatory Factor Analysis (CFA)
Unlike EFA, confirmatory factor analysis (CFA) starts with a hypothesis about how variables relate to underlying factors. Researchers use CFA to test and validate existing theories or models.
Key characteristics of CFA include:
Tests a predetermined factor structure
Evaluates how well the data fits the theoretical model
Provides statistical measures of model fit
Often used after EFA to confirm and refine findings
For example, if your previous research suggests that job satisfaction consists of three factors (pay satisfaction, relationship satisfaction, and work environment satisfaction), CFA would be able to test whether new survey data supports this three-factor model.
Principal Component Analysis (PCA)
Principal Component Analysis (PCA) is sometimes classified as a type of factor analysis, though statistically it’s slightly different. It emphasizes variance to identify patterns in the data and is beneficial when variables have high correlations.
Key characteristics of PCA include:
Focuses on explaining the maximum amount of variance
Creates components that are completely uncorrelated with each other
Often used for data reduction and simplification
Particularly useful with highly correlated variables
For example, in image processing, PCA might reduce thousands of pixels (variables) into a few key components that capture most of the information in the image.
Other Types of Factor Analysis
Beyond these main types, factor analysis comes in several variations tailored to specific research needs:
Two-Way Factor Analysis: Analyzes the influence of two factors on outcomes.
Three-Way Factor Analysis: Considers the impact of three factors, useful for complex studies.
Multivariate Analysis of Variance (MANOVA): Deals with multiple dependent variables influenced by multiple factors.
Factor ANOVA: Studies the impact of multiple categorical independent variables.
Key Elements of Factorial Analysis
Let’s break it down to make things simpler.
1. Factors: Factors are like categories in our study. For example, if we’re studying why people like certain movies, factors could be acting, plot, or special effects. Each factor is a different thing we’re looking at.
2. Loadings: Loadings tell us how much each factor affects something. Imagine we’re studying why people like ice cream. If ‘taste’ has a high loading, it means taste is a big reason people enjoy it. Loadings are like arrows pointing to the important parts.
3. Eigenvalues: It shows us how much of our data is explained by each factor. A high eigenvalue means that the factor is really important. Larger eigenvalues indicate more significant factors. When analyzing our study, if a factor has a high eigenvalue, it implies that this factor explains a substantial portion of the overall customer satisfaction variance.
4. Factor Rotation: A technique used to make factor loadings more interpretable by rotating the factor axes. Common methods include varimax (which maximizes the variance of squared loadings) and promax (which allows factors to be correlated).
5. Communalities: These represent the proportion of each variable’s variance that can be explained by the factors. Higher communalities indicate that the extracted factors explain a good amount of the variance in the variables.
Why use Factorial Analysis?
Factorial analysis is crucial, and there are many reasons to say so.
Factorial analysis is invaluable when dealing with multiple variables that may interact and influence each other. It is particularly useful in the following scenarios:
- Market Research: Understanding customer preferences and behaviors by analyzing multiple factors influencing purchasing decisions.
- Psychological Studies: Exploring various factors affecting human behavior and emotions, providing insights into psychological patterns.
- Product Planning and Development: Evaluating the impact of multiple variables on product features and customer satisfaction, guiding product enhancement strategies.
Here are some of the points you should consider:
1. Spotting Patterns:
Factorial analysis helps us see hidden patterns in data. Whether it’s customer choices or employee behaviors, it reveals trends we might miss. Businesses use these insights to make products people love.
2. Smart Decision-Making:
It guides smart decisions. By understanding what influences outcomes, businesses adjust their strategies. It’s about making the right choices based on solid data.
3. Saving Time:
For researchers, it’s a time-saver. Instead of drowning in data, factorial analysis helps focus on what matters. This means more efficient research and quicker results.
4. Predicting the Future:
It predicts future trends. By looking at past data, businesses can foresee what might happen next. This foresight helps in planning for the future.
5. Testing Ideas:
Researchers test their ideas with it. Factorial analysis proves or disproves theories. It ensures research is trustworthy and reliable.
How to Do Factorial Analysis: Step-by-Step Guide
Now, even if we have a complete understanding of the subject and can define any factor without missing a beat, the process makes all the difference. Though complex, with the right approach, factorial analysis becomes accessible. Here’s a simple guide you can follow:
#1 Define Your Factors
Start by identifying the factors you want to study. These could be product features, customer segments, or any variables relevant to your research. Each factor should represent a distinct aspect of your study.
#2 Gather Data
Collect data related to your identified factors. This could be survey responses, sales figures, or any quantitative information. Ensure your data is accurate and comprehensive, forming a solid foundation for analysis.
Choose an advanced tool for the process from here on. You can consider SurveySparrow if you want. The platform will let you create, collect, analyze, and act upon the insights drawn!

Explore Deeper Customer Insights with SurveySparrow
A personalized walkthrough by our experts. No strings attached!
#3 Choose the Right Analysis Method
Depending on your research questions and the number of factors involved, select the appropriate type of factorial analysis. Whether it’s a two-way analysis, three-way analysis, or multivariate analysis, the choice should align with your study’s complexity.
#4 Perform the Analysis
Utilize statistical software like SPSS or R to perform the factorial analysis. These tools automate complex calculations, making the process more manageable. The software will generate outputs like factor loadings and eigenvalues, which are crucial for interpretation.
#5 Interpret the Results
Understand the generated outputs. Factor loadings indicate the strength of relationships, while eigenvalues signify the importance of each factor. Interpretation is key; it involves translating these numbers into meaningful insights relevant to your study.
#6 Draw Conclusions
Based on your interpretation, draw conclusions about the relationships between factors. Identify patterns and trends. These insights can inform decision-making processes, from product development to marketing strategies.
#7 Communicate Your Findings
Be clear and precise. Present your findings systematically. You can use visuals like charts or graphs to illustrate relationships. Whether you’re communicating within a team or with stakeholders, clarity is paramount.
Best Practices While Conducting Factorial Analysis
If you want to maximize the effectiveness of factorial analysis, adhere to the following best practices:
- Thorough Data Cleaning: Ensure the dataset is free from errors, outliers, and inconsistencies to prevent skewed results.
- Appropriate Method Selection: Choose the right type of factorial analysis based on the research objectives, ensuring alignment between the method and the study’s goals.
- Factor Interpretation: Exercise caution while interpreting factors, considering the context and relevance of the variables involved.
- Continuous Learning: Stay updated with the latest statistical techniques and methodologies, enhancing the accuracy and depth of factorial analysis results.
Conclusion
We just cracked the code together, didn’t we?
And there you have it—understanding what consumers want boils down to smart analysis, like factorial analysis. By figuring out what people like, businesses can make products and services that hit the sweet spot. Or, even better, it’s all about making sense of what people love, one factor at a time.
Factor analysis might seem complex at first, but with practice and the right approach, it becomes an invaluable tool in your analytical toolkit. Whether you’re a researcher, business analyst, or curious learner, mastering factor analysis opens doors to deeper understanding of complex phenomena.
Remember, good factor analysis isn’t just about running the numbers—it’s about asking the right questions, preparing your data carefully, and interpreting the results with both statistical rigor and subject matter expertise.
Explore Deeper Customer Insights with SurveySparrow
A personalized walkthrough by our experts. No strings attached!

Create engaging surveys that people actually complete. Try SurveySparrow now!
Kate Williams
Frequently Asked Questions (FAQs)
Exploratory factor analysis (EFA) is used when you don’t have a predefined idea about the structure or number of factors in your data. It helps you discover patterns. Confirmatory factor analysis (CFA), on the other hand, tests whether your data fits a predetermined factor structure based on theory or prior research.
Most researchers recommend a minimum of 10-15 participants per variable, with a total sample size of at least 200 for reliable results. Smaller samples can be used but may lead to less stable factor structures. Complex models with many variables require larger samples.
Factor analysis aims to identify underlying latent factors that explain correlations among observed variables. It focuses on shared variance. Principal component analysis (PCA)is primarily a data reduction technique that creates components accounting for maximum variance in the observed variables.
Related Articles

Survey & Feedback
100+ Restaurant Survey Questions for Guest Feedback + Free Template
8 MINUTES
23 May 2022

Survey & Feedback
15 Types of Surveys: Complete Guide with Examples & Best Practices [2026]
18 MINUTES
13 February 2026

Survey & Feedback
Create Engaging Image Surveys: Complete Guide with Examples [2025]
8 MINUTES
7 November 2024

Survey & Feedback
7 Best Online Test Tools for Business and Education
11 MINUTES
15 May 2024
