
CSAT benchmarks help businesses understand whether their customer satisfaction is on par, or quietly falling behind industry standards.
A CSAT score on its own tells you very little.
An 80% CSAT score may represent industry leadership in one sector and underperformance in another. That's why CSAT benchmarks are essential for making customer satisfaction data actionable.
What is a CSAT score benchmark?
A CSAT score benchmark serves as a measuring stick for your organization's customer satisfaction performance. These benchmarks show up as percentage ranges that reflect how satisfied customers are across different industries and business sectors.
These reference points tell you if your satisfaction scores are good enough for your industry. You won't know if you're truly competitive without them.
The American Customer Satisfaction Index (ACSI) offers some of the most trusted industry benchmarks for customer satisfaction scores. These standards get regular updates to match customer expectations and market changes, which makes them perfect for today's comparisons.
A benchmark comparison looks at two main areas:
- Internal benchmarking - Looking at your past performance to track progress
- External benchmarking - Seeing how you stack up against competitors and industry averages
Your CSAT scores make more sense when you look at them next to your industry, company size, and specific customer touchpoints. This gives you better insights than just trying to hit a random high number.
SurveySparrow helps you measure CSAT using standardized rating scales, automated calculations, and clean dashboards—so your benchmarks actually mean something. |
Why industry standard CSAT scores matter
Industry standard CSAT scores give you the right context for your customer satisfaction measurements. These benchmarks help you:
Set realistic goals - Knowing what makes a "good" CSAT score in your field keeps you from setting impossible targets that might discourage your team. An 85% score could be amazing in one industry but just okay in another.
Find competitive edges - You've found a way to stand out when your CSAT scores beat industry benchmarks. This edge in customer experience can help your business grow faster.
Use resources wisely - Industry benchmarks show you which parts of customer experience need work right now and where to focus your efforts.
See real progress - Measuring against established benchmarks shows your actual improvements instead of random numbers.
Customer satisfaction drives loyalty and retention. Research shows that retaining existing customers is 5 to 25 times more valuable than finding new ones. [Bain & Company]
Watching your CSAT score against industry standards helps you readjust your customer experience strategies during various touchpoints.
These benchmarks also show how customer expectations change. What customers loved five years ago might barely satisfy them today.
Keeping up with benchmark trends helps you adapt to what customers want. In short, CSAT benchmarks turn customer satisfaction from a vanity metric into a decision-making tool.
Turn CSAT insights into action—not just reports.
With SurveySparrow, you can trigger follow-ups, alerts, and workflows the moment a CSAT score drops—before dissatisfaction turns into churn.

Explore how SurveySparrow can transform your feedback process.
TRUSTED BY BEST-IN-CLASS BRANDS


How to interpret CSAT benchmarks
You need to understand what different score ranges mean and how they fit your business to make sense of CSAT benchmarks.
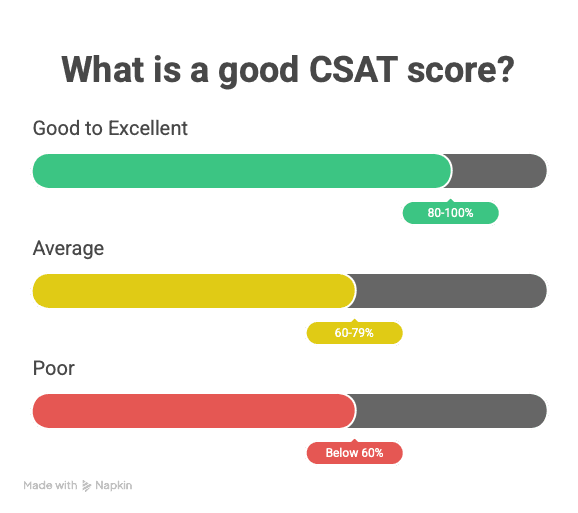
| CSAT Score (%) | Performance Level | Interpretation |
|---|---|---|
| 80-100% | Good to Excellent | Indicates strong satisfaction and loyalty |
| 60-79%: | Average | Functional but room for improvement in key areas |
| Below 60% | Poor | Signals significant issues requiring immediate fixes |
These ranges give you a starting point, but expectations vary by industry. Take 2023 for example - fast food (quick-service) restaurants averaged 77% CSAT, while full-service hit 80%.
What counts as a good CSAT score varies by industry and context. For a detailed breakdown of how to interpret your score, check out our guide on what is a good CSAT score.
Look at these factors when reading benchmarks:
Response rates: Good CSAT surveys get 20% to 30% responses. Lower rates might not show true customer feelings.
Cultural differences: Different regions have different expectations. What makes customers happy in one place might not work elsewhere.
Timing of measurement: CSAT scores change based on when you ask. Post-purchase happiness might differ from support interaction satisfaction.
Rating scales: Use similar rating scales for fair comparison. CSAT surveys usually use 1-3, 1-5, or 1-10 scales.
| Factor | Why It Matters | Best Practice |
|---|---|---|
| Industry standards | Expectations vary | Benchmark within your industry |
| Company size | Scale affects CX | Compare with similar-sized firms |
| Survey timing | Mood impacts scores | Measure post-interaction consistently |
| Rating scale | Impacts percentages | Use the same scale over time |
You can calculate the CSAT score using the formula: (Number of satisfied customers / Total respondents) x 100 = CSAT %
CSAT benchmarks by industry 2026
| Industry | Average CSAT Benchmark |
|---|---|
| SaaS / Technology | 78% |
| Retail & eCommerce | 76% |
| Healthcare | 80% |
| Financial Services | 80% |
| Energy & Utilities | 74% |
| Social Media Platforms | 73% |
| Internet Service Providers | 68% |
Key takeaway: Industries with higher emotional stakes (healthcare, finance) sustain higher CSAT benchmarks, while high-friction services (ISPs, utilities) face structurally lower ceilings.
Look at these factors when reading benchmarks:
- Response rates - Good CSAT surveys get 20% to 30% responses. Lower rates might not show true customer feelings.
- Calculation method - Make sure you calculate scores like the benchmark does. The basic formula is: (Number of satisfied customers / Total number of respondents) × 100 = CSAT %
- Cultural differences - Different regions have different expectations. What makes customers happy in one place might not work elsewhere.
- Timing of measurement - CSAT scores change based on when you ask. Post-purchase happiness might differ from support interaction satisfaction.
- Rating scales - Use similar rating scales for fair comparison. CSAT surveys usually use 1-3, 1-5, or 1-10 scales, with different ways to define "satisfied".
Mix CSAT with other metrics like Net Promoter Score (NPS) and Customer Effort Score (CES) to see the whole picture. CSAT shows immediate satisfaction, NPS measures long-term loyalty, and CES tells you how easy customers find it to work with you.
Focus on improving your CSAT scores over time instead of just hitting benchmark numbers. Steady improvement matters more than reaching specific targets, especially when you're actively working on customer feedback and making your service better.
Your customer satisfaction performance makes more sense when compared against industry standards. Customer expectations continue to change as we look toward 2026. These standards vary among different sectors. Let's get into what they mean for your business.
Software and SaaS CSAT standards
Software and SaaS companies compete fiercely for customer satisfaction. Users in 2026 want smooth experiences. They have many options just a click away.
The average CSAT score for software/SaaS companies stands at 78% (Retently 2024). This makes it one of the most competitive sectors for customer satisfaction.
SaaS businesses can measure their performance against these standards:
| CSAT Score Range | Performance Level |
| Above 80% | Excellent - Leading the industry |
| 70-80% | Good/Average - Competitive |
| Below 70% | Poor - Retention risks ahead |
A 2023 study of mid-size software firms (100-1,000 employees) found averages up to 89%, but industry-wide remains ~78%—beating it requires standout CX. These higher scores typically reflect controlled samples, mature CX programs, or high-touch customer segments—not the broader SaaS market.
High CSAT expectations in SaaS stem from:
- Product reliability and uptime requirements
- Easy-to-use interface
- Quality of onboarding experience
- Quick support team responses
So, SaaS companies that want to lead the market should aim for CSAT scores of 85% or higher. This level of satisfaction drives both retention and referrals.
Healthcare and insurance CSAT standards
Healthcare and insurance sectors have better customer satisfaction scores now. Yet they face unique challenges in 2026. These industries must direct complex customer interactions that deal with sensitive personal information and critical services.
Healthcare providers' recent standards show CSAT scores between high 60s and low 80s. ACSI reports health insurance at 78% (2024 avg., up 2% from 2023's 76%). Life insurance hit 81% in 2024.
Best healthcare CSAT scores by service type:
- Non-hospital care: 81%
- Hospitals: 74%
- Outpatient care: 81%
- In-patient care: 72%
- Emergency room: 67%
Healthcare's unique CSAT challenges come from:
- Complex billing processes
- Wait times for appointments and services
- Communication gaps between providers
- Administrative burden on patients
- Emotional nature of many healthcare interactions
Insurance companies get better CSAT scores by focusing on quick claims processing, clear policies, and available customer service options. Life insurance has the highest satisfaction levels, likely due to predictable interactions and fewer claims.
Curious where you stand against these CSAT benchmarks?
SurveySparrow lets you track CSAT by industry, region, and touchpoint—so you’re always benchmarking against the right standards.
Retail and E-Commerce
Retail satisfaction is shaped by the entire purchase journey, from product discovery and checkout to delivery and returns. E-commerce specifically faces high expectations around speed, accuracy, and ease of returns.
The retail sector averages 76% CSAT overall, though performance varies significantly between in-store and online experiences.
Key drivers of retail CSAT are product quality, delivery speed and accuracy, ease of returns, and website or app experience.
If you're retail business has a CSAT below 76%, focus first on your post-purchase experience, since delivery communication and returns are the most common friction points in retail satisfaction.
Financial Services
Financial services companies maintain relatively high CSAT scores, because its driven largely by the trust and reliability customers expect when managing their money. Life insurance and personal banking tend to score higher, while credit card companies and investment services face more friction due to complex products and fee structures.
Key drivers of financial services CSAT are fee transparency, digital platform usability, security perception, and accessibility of customer support during critical moments.
In financial service businesses, a single frustrating experience can undo months of positive interactions. Therefore, real-time alerts and fast resolution are non-negotiable components.
Energy and Utilities
Energy and utilities companies operate in a structurally challenging environment. Customers often have little or no choice of provider, so satisfaction is driven more by absence of problems than by positive experiences.
Key drivers of utilities CSAT include billing clarity, outage communication, ease of resolving issues, and digital self-service options.
In utility-based sectors, reducing friction is more impactful than creating delight. Proactive outage communication and clear billing are the highest-leverage improvements available.
Social Media Platforms
Social media platforms face a unique satisfaction challenge, users have strong opinions about product decisions, privacy policies, and algorithm changes largely outside the platform's direct control.
Key drivers in this sector include platform reliability, content quality controls, privacy transparency, and responsiveness to user feedback.
Internet Service Providers
ISPs consistently rank among the lowest CSAT performers. The sector averages 68% CSAT, with outages, slow speeds, and difficult support interactions being the primary drivers of dissatisfaction.
Key drivers are connection reliability, technical support quality, transparency around outages, and pricing clarity.
Common CSAT Benchmarking Mistakes
You need the right standards to measure customer satisfaction accurately. Many organizations blindly trust raw survey results. They miss key factors that can throw off their results, even with simple CSAT surveys.
Using inconsistent rating scales
Companies often switch between different rating scales - a common mistake that ruins historical comparisons. CSAT surveys can use 5-point, 7-point, or 10-point scales. Each scale gives different results.
A 5-point scale lets organizations count 4-5 ratings as "satisfied" customers in their CSAT percentage. The problem starts when they switch to a 10-point scale mid-program. Should they count 8-10 or 7-10 as equal to the old 4-5 threshold?
This creates several problems:
- Past comparisons become useless
- Team scores change due to technical reasons, not real performance
- You can't compare yourself to competitors or industry standards anymore
Pick one rating scale and question format that matches your business goals. Stick with it for the long run. If you must change, use both scales together during the switch. This helps you convert between old and new measurements.
Ignoring cultural bias in responses
Culture plays a big role in how customers answer satisfaction surveys. Many companies miss these differences when they look at their CSAT scores. Research shows that different cultures use rating scales differently. Some tend to be more critical, while others give positive responses for the same level of service.
North American customers rate experiences more positively than European customers, even with the same service quality. Global companies need different standards for each region instead of one universal target.
This bias shows up in several ways:
- Some cultures pick extreme ratings while others stay in the middle
- Different views on what makes service "satisfactory"
- Varying tolerance levels for bad service
Good results in one market might look bad in another when you factor in cultural context. Smart organizations create specific standards for each region to account for these cultural differences.
Different demographic groups might also respond differently to surveys. You'll measure true satisfaction by adjusting your approach to these differences.
Over-relying on CSAT without context
CSAT surveys give quick insights into customer feelings. 93% of CX leaders use survey metrics like CSAT as their main way to measure CX performance. Only 15% feel happy with their approach, and just 6% believe their system helps them make both strategic and tactical decisions.
The main issue lies in CSAT's focus on specific interactions rather than the customer's entire experience. A customer might like one interaction but still feel frustrated with your overall service or product.
Regular CSAT surveys only get 10% to 30% response rates. These responses usually come from extremely happy or unhappy customers, leaving out most people's opinions.
You can fix these limitations by:
- Using CSAT with NPS and Customer Effort Score
- Looking at CSAT alongside operational metrics like first contact resolution
- Breaking down CSAT results by customer type, product, and channel
- Using AI-powered sentiment analysis for better insights
CSAT works best when you know its limits and add other data points for context.
Explore a CSAT survey template.
Failing to act on feedback
Companies often collect CSAT data but don't use it well. Customer feedback only matters when it leads to better service and operations.
Many businesses treat CSAT as just another report instead of a tool for growth. They measure satisfaction regularly but don't fix the problems they find. This wastes money and breaks customer trust when issues stay unresolved.
Good CSAT programs need:
- Systems to send feedback to the right teams
- Clear deadlines to fix problems
- Regular checks on progress
- Updates to customers about changes made
The best companies set up automatic workflows based on CSAT scores. Low scores alert managers quickly, while high scores might trigger thank-you messages or referral requests.
Every 1 or 2 rating should create an immediate task. Managers need alerts within hours, not days. Quick responses show customers that their input matters and you'll fix problems fast.
These tips will help you understand your customers' true satisfaction levels better. You can make smart decisions that really improve customer experience instead of chasing misleading numbers.
Most CSAT benchmarking mistakes come from bad survey design or low response rates.
SurveySparrow’s conversational surveys increase response rates by up to 40%—giving you more reliable CSAT data to benchmark against.
Explore how SurveySparrow can transform your feedback process.
TRUSTED BY BEST-IN-CLASS BRANDS
Common CSAT Benchmarking Mistakes (Quick Reference)
| Mistake | Impact |
|---|---|
| Inconsistent rating scales | Breaks historical comparison |
| Ignoring cultural bias | Skews global benchmarks |
| CSAT used alone | Misses loyalty and effort context |
| Low response rates | Results lack representativeness |
| No action on feedback | No CX improvement |
How to Improve Your CSAT Score
Measuring your CSAT score is only the starting point. The businesses that lead on customer satisfaction don't just track the number, but build systematic processes to act on what it tells them. Companies that invest in customer experience improvements see revenue increases of 10–15% and cost reductions of 15–20%. (McKinsey, 2022).
Here are five proven strategies that consistently move the needle.
1. Optimize customer support interactions
Support interactions are where satisfaction is won or lost most often. A single poorly handled conversation can undo weeks of positive experience — and customers remember it.
- Train agents in empathy, not just process. Your team should listen well and solve problems. This ensures customers get thoughtful support when they need it.
- Reduce wait times. Zendesk's 2026 CX Trends Report shows that customers hate long hold times more than anything else. Better staffing and callback options can cut down this frustration.
- Prioritize first-contact resolution (FCR). About 95% of customers stay with companies that solve problems in one call. This drops to 91% when it takes multiple calls. Give your agents the tools and authority to fix issues on the first try.
- Monitor call quality – Quality assurance tools and scorecards help review interactions. Look at tone, accuracy, and problem-solving to find ways to get better.
2. Use in-app and real-time surveys
Regular CSAT surveys get low responses—only 5-10% of customers answer them. (Survicate, 2023)
This makes it hard to understand what customers really think. In-app surveys work better, with response rates of 25-30%. These give you more detailed and accurate feedback.
In-app CSAT surveys work well because they:
- Get feedback right after the experience
- Feel natural as part of the product
- Show insights about specific features or actions
The timing and design of your surveys matter. Send them after key moments like finishing onboarding, trying new features, or closing support tickets. Short surveys work best—one to three questions keep people engaged without overwhelming them.
3. Personalize customer experiences
Personalization has moved from a nice-to-have to a baseline expectation. Fast-growing companies generate 40% more revenue from personalization than slower-growing competitors (McKinsey, 2021) — and 76% of customers say personalized communication makes them more likely to notice a brand.
Effective personalization means:
- Tailoring support responses based on purchase history and past interactions
- Adjusting messaging based on where customers are in their lifecycle
- Creating content and recommendations that reflect individual behavior and preferences
The payoff is measurable — 78% of customers say they are more likely to repurchase from brands that deliver personalized experiences (McKinsey, 2021).
4. Use AI for faster resolutions
Speed is one of the top drivers of support satisfaction — and AI is the most scalable way to improve it. Companies using AI in customer service resolve issues 60% faster on average (Salesforce State of Service Report, 2024).
AI adds value across the support experience:
- Automated responses to high-volume, low-complexity queries — password resets, order tracking, account updates
- Real-time suggestions for agents during live interactions
- Predictive identification of customers at risk of dissatisfaction before they escalate
- 24/7 availability without proportional increases in staffing costs
And, businesses using AI in customer service report average CSAT improvements of 65% (Salesforce State of Service Report, 2024).
5. Follow up after fixing problems
Service recovery is one of the most underleveraged CSAT improvement strategies. Only 5% of support teams excel at it — but those that do achieve CSAT scores of 77% compared to 47% for average performers (Ascent Group, 2023).
Effective service recovery:
- Respond within 24 hours of a negative interaction or low CSAT score
- Acknowledge the experience without being defensive — customers want to feel heard first
- Confirm the resolution worked — verify the fix held, not just that the ticket was closed
- Make it right — a discount, credit, or sincere personal message rebuilds trust
Without service recovery, average NPS sits at -16. With effective recovery, it jumps to +45 (Harvard Business Review, 2022) — a 61-point swing driven entirely by how you handle things when they go wrong.
Conclusion
A good CSAT score goes beyond raw percentages. You need to think about your specific industry, company size, and customer expectations. The benchmarks explored here give you the right context to assess your customer satisfaction performance — not just chase arbitrary numbers.
CSAT scores vary significantly across industries. Healthcare and financial services average 80%, SaaS targets 78–80%, retail sits around 76%, and ISPs lag at 68%. These gaps reflect different customer expectations and structural challenges in each sector. Comparing yourself to global averages without industry context will paint a misleading picture of your performance.
Your measurement approach is just as important as the scores. Use consistent rating scales, account for cultural differences, and always pair CSAT with NPS and CES to get a complete view of the customer experience.
Measuring satisfaction is just the start; whereas taking action on feedback is what creates real value. Optimize support interactions, collect real-time feedback, personalize experiences, use AI for faster resolutions, and follow up when things go wrong.
Perfect 100% satisfaction isn't realistic, but steady improvement signals stronger customer relationships. Each percentage point gained typically correlates with better retention, more referrals, and higher lifetime customer value.
Top organizations treat CSAT not as a performance metric but as a growth engine, building systematic processes to collect, analyze, and respond to feedback at every touchpoint.
Start measuring CSAT the right way.
Join thousands of teams using SurveySparrow to track CSAT benchmarks, act on feedback faster, and build better customer experiences—without complex setups.
Explore how SurveySparrow can transform your feedback process.
TRUSTED BY BEST-IN-CLASS BRANDS


")

")