
Keeping clients costs way less than finding new ones. Yet many content businesses chase new clients while ignoring why current ones leave.
Customer experience metrics show what clients really think. These numbers warn you before clients quit. Track them and you'll keep clients longer.
Why These Metrics Matter
Content work is subjective. One client loves your blog post, another thinks it's bland. This makes measuring satisfaction tricky but super important.
Revenue and completed projects don't tell the whole story. A client might pay on time but secretly plan to leave. CX metrics catch these warning signs early.
Track the right numbers and you spot problems fast. Small drops in scores tell you to fix things now, not after clients have already left.
Meeting Client Expectations
Keeping clients starts with meeting what they expect. Content businesses must understand what clients actually want versus what they say at first.
The best content services nail client expectations from day one. When clients need something done quickly and well, top agencies clarify everything upfront - what you'll get, when you'll get it, and what quality looks like. Services that fulfill write my paper for me requests with clear communication about scope and standards build trust that keeps clients coming back. Professional writers must deliver well-structured, polished work that matches exactly what clients expect.
Set clear expectations, then beat them. That's how you create loyal clients. Measuring how well you meet expectations shows what works and what needs fixing.
Net Promoter Score Basics
NPS measures loyalty with one question: "Would you recommend our services?" Clients answer 0-10. Scores 9-10 are Promoters. Scores 7-8 are Passive. Scores 0-6 are Detractors.
Calculate NPS by subtracting Detractors percentage from Promoters percentage. Scores go from -100 to +100. Above 0 is okay. Above 50 is great. Most content businesses score 30-50.
NPS tools predicts future behavior. Promoters renew and refer. Detractors leave and might trash-talk you. Passive clients sit on the fence.
Survey clients every three months. Don't wait for year-end reviews. Regular check-ins catch problems early.
14-day free trial • Cancel Anytime • No Credit Card Required • No Strings Attached
Satisfaction Scores
CSAT measures happiness with specific work. Ask "How satisfied were you with this project?" after delivery. Use 1-5 scale where 5 is very satisfying.
Calculate CSAT as percentage choosing 4 or 5. Aim for 80% or higher. Lower means quality problems.
Measure CSAT at multiple points. After drafts, revisions, and final delivery. This shows which parts of your process work and which annoy clients.
Track scores by client and project type. Patterns show your strengths and weaknesses. Maybe you nail blog posts but struggle with white papers.
Customer Effort Score
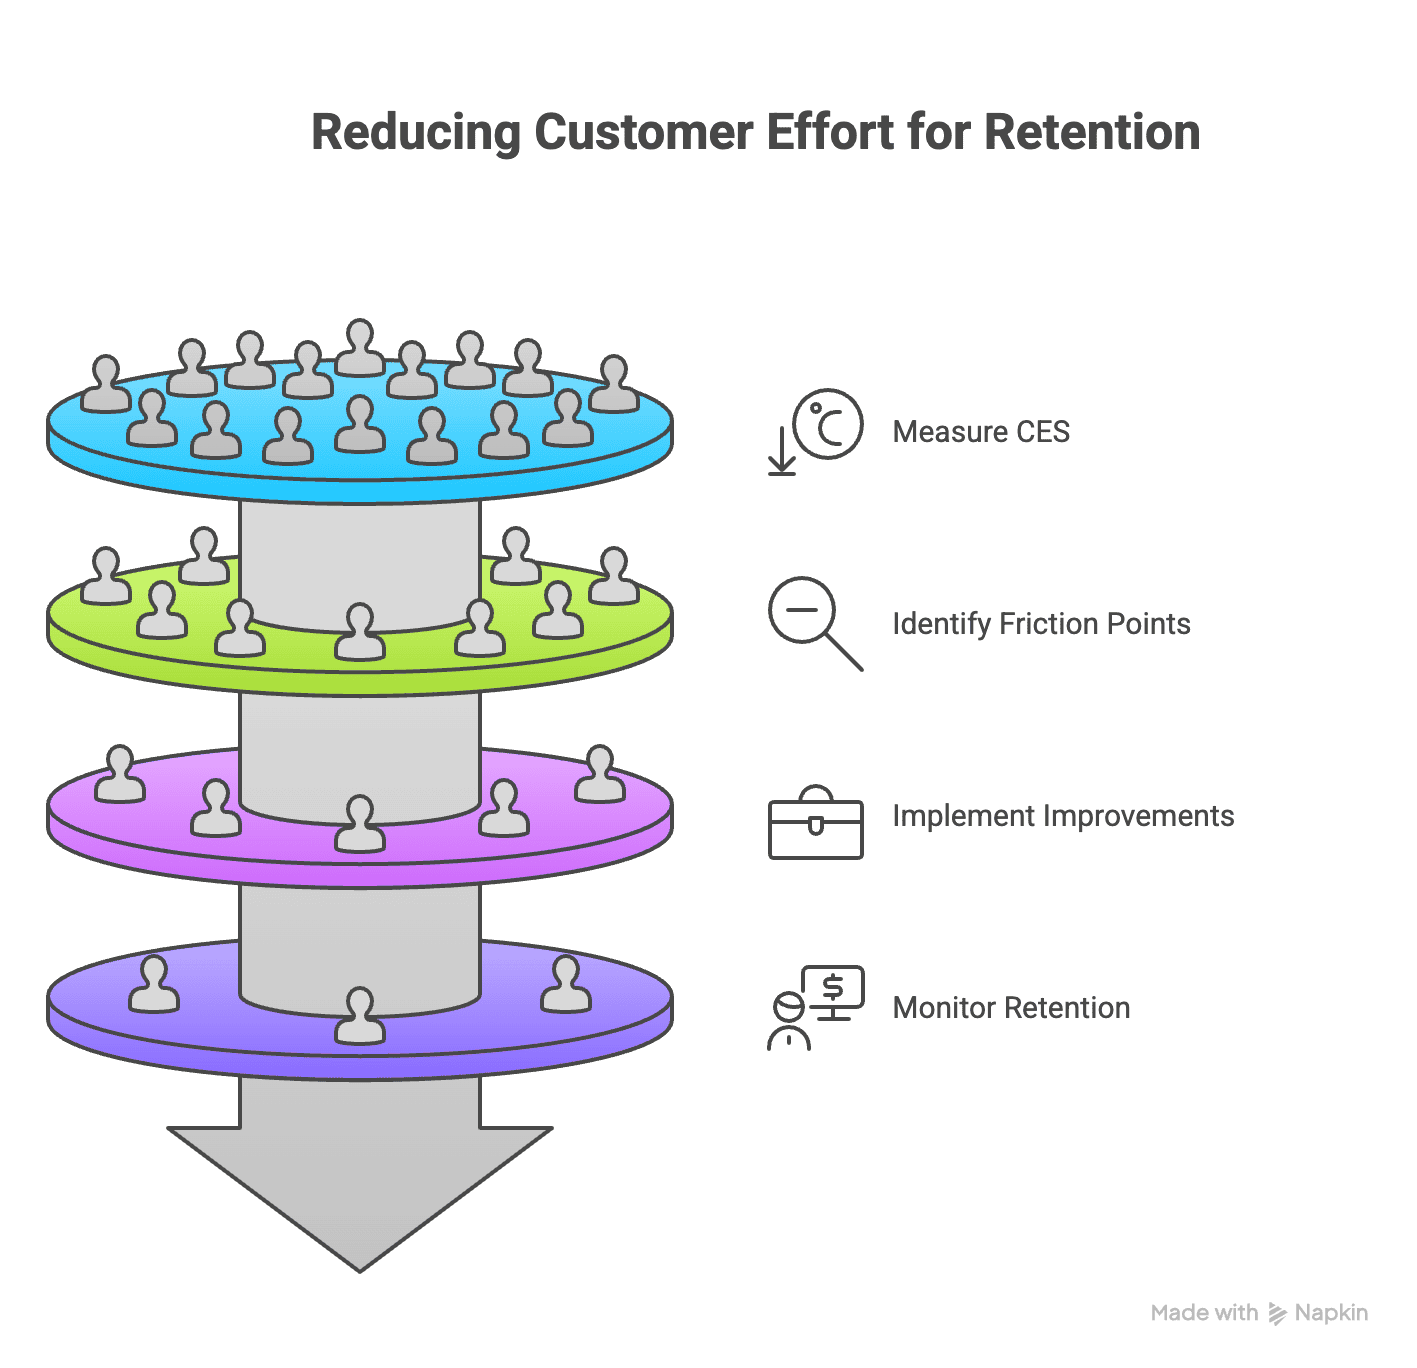
CES measures how easy you are to work with. Question: "How much effort did working with us require?" Scale 1-7 where 7 is very high effort.
Lower effort means better retention. Clients who find you effortless stick around. Every extra email or revision increases effort and hurts the relationship.
Content businesses create effort through poor communication. Vague instructions need lots of back-and-forth. Late deliveries mess up client schedules. Inconsistent quality means extra revisions.
Measure CES after onboarding and big projects. Find friction points. Then fix them.
How Fast You Respond
Response speed impacts satisfaction hugely. Track how long you take to answer emails, questions, and revision requests.
Respond to client emails within 4 hours on business days. Urgent stuff needs answers within 1 hour. Miss these targets and satisfaction drops.
Make sure no message goes unanswered for more than 24 hours. Clients don't expect instant replies but they need to know you got their message.
Track response times by person and channel. Some writers check Slack but ignore email. Knowing this helps you route messages better.
Quality Consistency
Clients want consistency. Brilliant work sometimes and mediocre work other times creates problems. They never know what they'll get.
Measure consistency through revision rates. Track how many drafts get approved without changes. Low first-draft approval means quality bounces around.
Track client feedback in a database. Note praise and complaints. Patterns show which content types or writers generate good versus bad feedback.
Create quality checklists for different content. Score each piece before sending it to clients. Catch problems before clients see them.
On-Time Delivery
Deliver on time. Seems basic but many content businesses fail here. Late deliveries force clients to redo their schedules. According to research, shows people naturally choose easy tasks first, but tackling challenging ones yields better results.
Track percentage of projects delivered by deadline. Aim for 95% or higher. Measure average delays when you're late.
Track internal deadlines separately from client deadlines. If writers miss internal deadlines a lot, you have no buffer for quality checks. This means rushed work or late delivery - both bad.
Flag at-risk projects early. When writers fall behind, reassign work or adjust deadlines. Surprising clients with last-minute delays hurts way more than asking for extensions earlier.
Track These Numbers
Content businesses should monitor:
- Net Promoter Score (every 3 months)
- Customer Satisfaction Score (every project)
- Customer Effort Score (every 3 months)
- First-draft approval rate (monthly)
- Average revisions per project (monthly)
- On-time delivery rate (monthly)
- Response time to messages (weekly)
- Client churn rate (monthly)
- Revenue per client (every 3 months)
These paint the full picture of client experience. Track consistently and share with your team.
Client Churn Rate
Churn rate shows the percentage of clients who stop working with you. Calculate monthly and yearly. Both give useful info.
Aim for under 5% monthly churn and under 30% yearly. Higher rates mean big retention problems.
Find out why clients leave through exit interviews. Track reasons: pricing, quality, communication, changing needs, or moving in-house. Patterns show fixable problems.
Look at churn by client type. Small businesses might leave due to budget. Enterprises might leave due to quality. Understanding this helps target retention efforts.
Revenue Retention
Keeping clients matters but keeping revenue matters more. Some clients stay but spend less. Others expand spending a lot.
Track gross revenue retention. This is revenue from existing clients now divided by revenue from same clients last period. Below 100% means they spend less. Above 100% means more.
Content businesses should aim for 110-120% net revenue retention yearly. This means growing revenue from existing clients through upsells.
Watch revenue per client over time. Identify who's spending more versus less. Reach out to declining accounts fast. Often you can fix concerns before they cut spending or leave.
Act on Feedback
Numbers mean nothing without action. Share CX metrics with your team monthly. Discuss trends and solutions together.
Create action plans for recurring issues. High revision rates for certain content? Improve templates or training. Slow response times? Better notifications or lighter workloads.
Follow up with clients who give negative feedback. Thank them and explain what you're changing. This turns haters into fans by showing you actually listen.
Celebrate when metrics improve. Share client praise widely. Positive reinforcement works better than criticism.
Use the Right Tools
Use proper tools for tracking. Spreadsheets work at first but don't scale. The best survey platform automates your business collection and analysis, which boost your progress.
14-day free trial • Cancel Anytime • No Credit Card Required • No Strings Attached
Get a CRM tracking all client interactions. Note scores, project details, and communications in one place. This helps spot patterns.
Set up automated surveys. Post-project CSAT surveys are sent automatically. Quarterly NPS surveys schedule themselves. Automation means consistent measurement without manual work.
Create dashboards showing key metrics at a glance. Update weekly. Easy access encourages regular review and faster fixes.
Conclusion:
Data without action is useless. When metrics show problems, respond immediately. Dropping NPS predicts churn within 90 days. Falling CSAT means quality issues now.
Set alert thresholds. If any client's satisfaction drops below a level, investigate immediately. Proactive outreach often saves relationships.
Look at metrics by client type, service, and team member. Overall numbers hide details. One bad writer might tank your CSAT while others do great.
Test changes and measure results. When you improve onboarding based on high CES, check if CES drops afterward. Confirm your efforts actually work.
Tracking CX metrics changes everything. You spot problems before clients leave. You do more of what works and fix what doesn't. Client retention jumps when you measure and act on what matters to them.


 on Your Website")
