How to Calculate Margin of Error: Simple Steps + Free Calculator
Want to clear uncertainty in your sample estimate, try our margin of error calculator. Find the accurate MoE and make your survey interpretation more accurate!
14-day free trial • Cancel Anytime • No Credit Card Required • No Strings Attached

Calculate Margin of Error
The acceptable values of margin of error typically lie between 4% & 8% at a confidence level of 95%
Margin of Error
0
NOTE: Please don’t confuse confidence level with the confidence interval. The latter is just an alternate name for margin of error.
Sample Proportion:
This is the percentage of people in surveys that exhibit certain characteristics.
Sample Size:
The sample size is the number of people you are surveying or studying.
Confidence Level:
The percentage of how closely your sample represents the population.
What is Margin of Error and Why It Matters
Surveys capture a snapshot of what a small group thinks to understand an entire population's views. But no sample perfectly represents everyone. The margin of error plays a vital role - it shows how much your survey results might differ from the actual opinions of the entire population.
Definition of margin of error in surveys
The margin of error measures random sampling error in survey results. It shows the degree of uncertainty around an estimate or measurement. This plus-or-minus percentage (±%) indicates the range where the true population value likely falls with a specified confidence level.
Let's say a survey shows 60% of respondents prefer a certain product with a ±3% margin of error at 95% confidence level. The true percentage in the population likely falls between 57% and 63%. The margin of error helps us measure our confidence in survey findings since we can't talk to everyone.
The formula to calculate margin of error combines these factors:
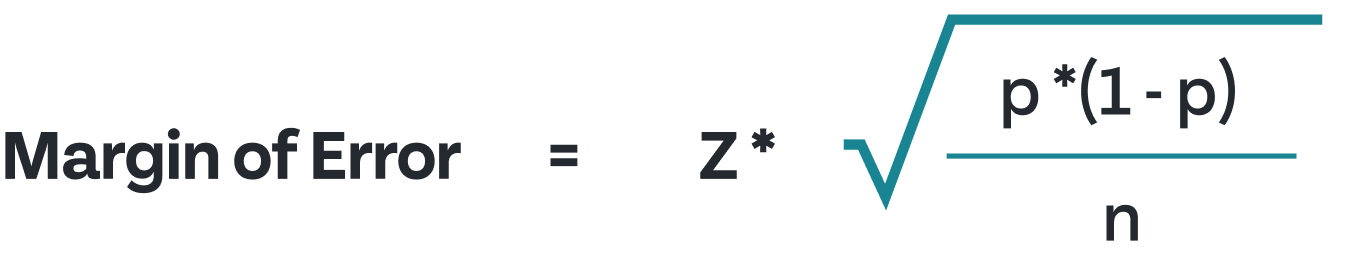
The z-score matches your desired confidence level, p represents the sample proportion, and n is your sample size. A standard 95% confidence level uses a z-score of 1.96.
How margin of error reflects survey accuracy
Your survey results' reliability shows through the margin of error. A smaller margin suggests greater precision and results closer to true population values. A larger margin points to more uncertainty and a wider range of possible outcomes.
These factors affect the margin of error:
- Sample size: Bigger samples usually mean smaller margins of error. The relationship isn't linear - doubling your sample from 1,000 to 2,000 only cuts the margin by about one percentage point.
- Population variability: More varied populations need larger samples to achieve the same margin of error.
- Confidence level: Higher confidence levels (99% vs 95%) create wider margins of error.
Most research aims for a margin of error between 4% and 8% at 95% confidence level. The margin of error peaks at 50% sample proportion and drops as the proportion moves toward 0% or 100%.
Difference between margin of error and sampling error
People often mix up margin of error and sampling error, but they're different. Sampling error happens because we study a subset instead of the whole population. This error shows the gap between sample statistics and population parameters.
The margin of error summarizes sampling error and measures uncertainty. Think of it as sampling error in practice - a ± value creating a confidence interval around your sample statistic.
The American Association for Public Opinion Research (AAPOR) puts it simply: "The margin of error is the price you pay for not talking to everyone in the population you're targeting". This range shows where the answer would likely fall if you'd surveyed everyone.
It's worth mentioning that margin of error only works with probability-based surveys where participants have known chances of being included. Online opt-in surveys and non-probability polls use a "credibility interval" instead.
Understanding Confidence Level and Confidence Interval
You need to understand two critical statistical concepts to calculate an accurate margin of error: confidence levels and confidence intervals. These interrelated terms are the foundations of interpreting survey results and determining your findings' reliability.
What is a confidence level?
A confidence level shows the percentage of times you would expect to get similar results if you repeatedly sampled the same population using similar methods. Put simply, it tells you how certain you can be that your sample reflects the entire population you're studying.
Statisticians use confidence levels to indicate the probability that the estimation method would produce intervals containing the true population parameter. A 95% confidence level means if you ran the same survey 100 times with different random samples from a similar population, about 95 of those samples would produce confidence intervals with the true value.
People often think the confidence level shows the probability that a specific calculated interval has the true parameter value. This isn't right—the true parameter doesn't change. Your calculated interval either has the true value or doesn't once you've collected your data.
How confidence intervals relate to margin of error
The confidence interval and margin of error share a simple relationship:
Confidence Interval = Point estimate ± Margin of error
The margin of error represents the "plus or minus" figure in your results, while the confidence interval shows the actual range where the true population parameter likely falls. To cite an instance, see a survey showing 56% support for a candidate with a ±4% margin of error at a 95% confidence level - the confidence interval would be 52% to 60%.
The formula to calculate a confidence interval has three key components:
- The point estimate (such as a sample mean or proportion)
- A critical value (z-score) derived from the chosen confidence level
- The standard error of your estimate
The margin of error becomes the product of the z-score and standard error, creating the "radius" of your confidence interval. Then, as your confidence level increases, so does your z-score—and your margin of error grows wider.
Common confidence levels: 90%, 95%, 99%
Researchers usually pick from several standard confidence levels, with 95% being most common in biological and social sciences. Each confidence level links to a specific z-score used in calculations:
- 90% confidence level: z-score = 1.645
- 95% confidence level: z-score = 1.96
- 99% confidence level: z-score = 2.576
These values show how many standard deviations from the mean you need to capture the specified percentage of a normal distribution.
Choosing between confidence levels means balancing precision against certainty. A 99% confidence level offers greater assurance but creates a wider interval than a 95% level using the same data. Higher confidence levels just need wider intervals to increase the probability of capturing the true parameter.
The sort of thing I love about real-life applications is how they need different confidence levels based on what's at stake. A 95% confidence level is enough for routine market research, while medical or safety-critical research might justify 99% confidence despite wider intervals.
Statistics never offers 100% confidence levels in practice—getting absolute certainty would mean studying the entire population, which eliminates the need to sample. Measurement errors could still exist even then.
| Confidence Interval | z-score |
|---|---|
| 80 | 1.28 |
| 85 | 1.44 |
| 90 | 1.65 |
| 95 | 1.96 |
| 98 | 2.33 |
| 99 | 2.58 |
How to Calculate Margin of Error: Step-by-Step
Calculating the margin of error might seem daunting at first. Breaking it down into manageable steps makes the process straightforward. My years of working with survey data have shown that a systematic approach produces the most reliable results.
Step 1: Choose your confidence level
You need to decide how confident you want to be in your results. The confidence level shows the probability that your confidence interval contains the true population parameter. Most researchers pick from three standard options:
- 90% confidence level (z-score = 1.645)
- 95% confidence level (z-score = 1.96)
- 99% confidence level (z-score = 2.58)
The 95% level works best for most projects because it balances precision and reliability. Note that higher confidence levels need wider intervals, giving you more certainty but less precision.
Step 2: Find the sample proportion (p-hat)
The sample proportion (p-hat) represents the percentage of your sample with the characteristic you're measuring. The calculation is straightforward:
p-hat = Number of successes ÷ Sample size
To cite an instance, if 380 out of 1000 survey respondents answered "yes," your p-hat would be 0.38 or 38%. This proportion becomes vital in the next calculation steps.
Step 3: Use the correct formula based on sample size
Your sample size determines which formula to use and whether you know the population standard deviation:
For large samples (n ≥ 30) with known population standard deviation:
- Use z-score method with the population standard deviation
For small samples (n < 30) or unknown population standard deviation:
- Use t-score method with the sample standard deviation
The t-distribution suits smaller samples better since we rarely know the population standard deviation.
Step 4: Calculate standard error
Standard error shows how much your sample statistic varies from sample to sample. The formula changes based on what you measure:
For proportions: Standard Error = √[p-hat(1-p-hat)/n]
For means: Standard Error = s/√n (where s is the sample standard deviation)
My research projects show that mistakes happen most often during standard error calculations—this step needs extra attention.
Step 5: Multiply by z-score or t-score
The final step multiplies your standard error by the appropriate critical value (z-score or t-score) based on your chosen confidence level:
Margin of Error = Critical Value × Standard Error
A sample calculation with 0.4 proportion, 100 size, and 95% confidence level looks like: ME = 1.96 × √[0.4(1-0.4)/100] = 1.96 × 0.049 = 0.096 or 9.6%
Online margin of error calculators make these calculations easier. They work great for quick estimates before detailed analysis.
Experience teaches an interesting lesson: larger samples reduce margin of error, but not linearly. Your margin of error halves when you quadruple the sample size. This explains why major polls use 1000-1500 respondents—additional precision costs too much beyond this point.
Margin of Error Formulas and When to Use Them
The accuracy of your results depends on selecting the right formula to calculate your margin of error. My statistical work experience shows that sample size and population knowledge determine the best method to use.
Z-score method for large samples
You should use the z-score method with larger samples (n ≥ 30), especially when you know the population standard deviation. The formula relies on a z-score based on your desired confidence level:
Margin of Error = z-score × (standard deviation / √sample size)
A z-score of 1.96 corresponds to a 95% confidence level. This formula fits perfectly for surveys with high response rates. Political polls use this approach because they sample more than 1000 people.
My go-to tools are online z-score calculators because they make the process simple. A sample of 1000 respondents at 95% confidence level yields a maximum margin of error of about ±3.1%.
T-score method for small samples
Small samples (n < 30) require the t-score method. This approach handles the extra uncertainty small datasets bring:
Margin of Error = t-score × (sample standard deviation / √sample size)
Your confidence level and degrees of freedom (sample size minus one) determine the t-score. T-scores grow larger as sample sizes get smaller.
Formula for proportions vs means
The standard error calculation varies between proportions and means:
For proportions: Standard Error = √[p(1-p)/n]
P represents the sample proportion while n stands for sample size.
For means: Standard Error = s/√n
S represents the sample standard deviation.
Proportion calculations appear frequently in surveys (like "75% of customers prefer our product"). Mean calculations show up more often in experimental research.
Using population standard deviation when known
A more precise formula becomes available when you know the population standard deviation (σ):
Margin of Error = z-score × (population standard deviation / √sample size)
Manufacturing or quality control settings with historical data might use this formula, though it rarely applies to surveys.
Most ground surveys use standard error with sample statistics because population parameters remain unknown. These formulas might look complex at first. You'll find choosing the right one becomes natural with practice.
Factors That Influence Margin of Error
Survey results' precision depends on several important factors. My years of analyzing survey data have shown me how certain elements affect margin of error calculations. Here's what I've learned about these vital influences.
Impact of sample size on margin of error
Sample size and margin of error have an inverse relationship - your margin of error decreases as your sample gets larger. My client work has shown this relationship isn't linear. The margin of error drops by just one percentage point when you double your sample from 1,000 to 2,000. Major polling organizations use samples of 1,000-1,500 respondents because extra precision beyond this point costs too much without matching benefits.
Effect of population variability
Your margin of error rises directly with population variability - the spread of data values. A city with big income differences needs a larger margin of error (±$500,000) than one with similar incomes (±$200,000). This point comes up often when I help clients with demographic research.
How confidence level changes the margin
Your choice of confidence level substantially affects the margin of error. You need wider margins of error with higher confidence levels. My research projects show that moving from 95% to 99% confidence level makes your margin of error about 30% larger. This creates a critical balance between certainty and precision.
Role of sampling method (random vs non-random)
Statistical best practices tell us margin of error calculations work only with probability-based samples where each participant has a known selection chance. You can't calculate a true margin of error with non-probability methods like convenience sampling, judgment sampling, and quota sampling. Many organizations wrongly apply margin of error to opt-in online polls, which doesn't show their results' actual potential error.
FAQs
1. How is the margin of error calculated for a 95% confidence level?
- To calculate the margin of error for a 95% confidence level, multiply the standard error by 1.96 (the z-score for 95% confidence). The standard error is calculated as the square root of [(p(1-p))/n], where p is the sample proportion and n is the sample size.
2. What does a 4% margin of error signify in survey results?
- A 4% margin of error means that the true population value is likely to fall within 4 percentage points above or below the reported survey result. For instance, if a survey reports 60% with a 4% margin of error, the actual population value is likely between 56% and 64%.
3. How does sample size affect the margin of error?
- As sample size increases, the margin of error decreases. However, this relationship is not linear. Doubling the sample size only reduces the margin of error by about one percentage point. This is why many polls use sample sizes around 1,000-1,500 respondents.
4. Can margin of error be applied to all types of surveys?
- No, margin of error calculations are only valid for probability-based samples where each participant has a known chance of selection. It doesn't apply to non-probability methods like convenience sampling or opt-in online polls.
5. How do confidence levels impact the margin of error?
- Higher confidence levels result in larger margins of error. For example, increasing from a 95% to a 99% confidence level will increase the margin of error by approximately 30%. This creates a trade-off between certainty and precision in survey results.
See SurveySparrow in Action
Go conversational, get more responses. No credit card required.
A personalized walkthrough by our experts. No strings attached!
