Survey & Feedback
Best Survey Scale Examples: Your Guide to Decoding Audience Opinions
Explore powerful survey scale examples that reveal audience insights, from binary choices to nuanced emotional responses, helping researchers decode complex opinions with precision and clarity.

TRUSTED BY BEST-IN-CLASS BRANDS


Watch Customer Stories
Have you ever wondered why some surveys get better responses and insights than others? Well, the secret lies in employing the right survey scales!
Come to think of it. Why would you survey or study customer journeys? To understand their sentiments, attitudes, and opinions better. Right? For this, you need the backup of the right tools.
But don’t worry, we have curated the best survey scale examples, their features, and use cases.
But before that, let’s quickly understand the basics:
What are Survey Scales?

Survey Scales, or survey response scales, are tools used to measure people’s attitudes, behaviors, and opinions. They give respondents a set of options to choose from. Researchers or surveyors then analyze the responses and understand clearly and comparably how people feel about something.
Imagine you are a scientist measuring plant growth. You want to know the effect of different fertilizers on their heights. Instead of guessing the height, you’ll use a ruler to measure it. Right? This ruler provides a precise scale to measure the exact height of each plant in centimeters or inches.
Survey scales work similarly, but instead of measuring physical qualities, they measure opinions, attitudes, and experiences.
Now, different types of survey scales have different levels of measurement. The one you want depends on the information you want to gather. Although they may appear simple, these tools are crucial to comprehend human perception.
Let’s take a look at a few examples of survey scales.
Best Survey Scale Examples
By adopting diverse survey scales and blending them into our research, we better understand our target audience’s opinions, sentiments, and preferences. These insights help us to make informed decisions, shape strategies that resonate with our audience, and take meaningful actions that drive positive outcomes.
The true power of survey scales lies in their data-driven nature and ability to capture human perspectives’ richness and depth.
Here are the major scales you must include:
1. Dichotomous Scales: For Simplifying Complex Surveys
Dichotomous scales, forming the backbone of many Survey Scale Types, offer a binary choice to the respondents, such as “yes/no,” “true/false,” or “agree/disagree.” This scale provides clarity and simplicity, making it ideal for situations demanding direct and clear-cut opinions.

Imagine asking, “Do you like the new website design?” This is a perfect scenario for the dichotomous scale. It’s either a yes or a no. You can easily collect binary data and find out if the revamp was a hit or a miss.
While dichotomous scales allow a straightforward analysis of responses, their limitation lies in their inability to capture the nuances of respondent sentiment. Despite this, their simplicity and ease of use make them a versatile tool in a surveyor’s toolkit. It’s a must-have!
Key Features:
a. Binary Response Options
Participants are given two mutually exclusive choices on the dichotomous survey scale, typically “Yes” or “No.” This format allows for unambiguous answers, making interpreting and analyzing the collected data easy.
b. Ease of Use
Its simplicity makes it user-friendly and suitable for respondents from all backgrounds. Participants can quickly select their preferred response, reducing the time required to complete the survey.
c. Limited Cognitive Load
The scale reduces participants’ cognitive load by offering just two response options. This is particularly beneficial when collecting data from a wide range of respondents, including those with limited attention spans or decision-making abilities.
d. Objective Data Collection
The dichotomous survey scale is handy for gathering objective data and measuring binary outcomes. It is often employed to assess binary preferences, agreement or disagreement with a statement, or the presence of specific characteristics.
Where can it be used?
Surveys, Medical Diagnosis, Product Testing, and Voting Systems.
Example Questions
- Are you satisfied with the customer service you received? (Yes/No)
- Do you prefer working from home or in an office? (Home/Office)
- Is the patient allergic to penicillin? (Yes/No)
- Did the defendant commit the crime? (Guilty/Not Guilty)
2. Likert Scale: The Middle Ground of Subjectivity
Moving from binary choices to the spectrum of subjective responses, we come to Likert scale examples. From a scale of 1 to 5 or 1 to 7, Likert scales enable respondents to express varying levels of agreement or disagreement with a set of statements. This allows for a richer, more nuanced collection of data.
Take, for instance, the 5-point Likert scale as an example. It provides a mid-point for neutrality alongside two tiers of agreement and disagreement. This type of scale broadens the range of possible responses and simplifies data interpretation, offering detailed insight into respondent opinions.
Here is a Likert Scale Questionnaire made with SurveySparrow for reference:
(Oh hey, feel free to use and customize it if you like)
Likert Scale Questionnaire Template
Use This TemplateKey features:
a. Multiple Points of Response
Unlike binary scales that offer only two response options, the Likert scale provides respondents with multiple points of response, creating a continuum of choices. This unique feature allows participants to express their opinions with greater precision and granularity.
b. Neutral Midpoint
One distinctive aspect of the Likert scale is the inclusion of a neutral midpoint, often labeled “Neither Agree nor Disagree” or “Neutral.” This midpoint offers respondents an option when they neither fully agree nor disagree with a statement, preventing them from being forced into a stance.
c. Balanced Design
It typically incorporates positively and negatively worded statements, ensuring a balanced design. This approach helps control response bias and ensures that respondents pay attention to the statements rather than mindlessly selecting the same response for all items.
d. Ordinal Scale
The scale falls under the ordinal measurement category, meaning that the order of response options matters, but the intervals between them are not quantifiable. Despite its non-numeric nature, the Likert scale provides valuable ordinal data for comparative analysis
Where can it be used?
Customer satisfaction, Product opinions, Learning experiences, Event Feedback
Pro Tip!
Choices? Not too few, not too many – just right!
Labels? Clear & simple words for each option.
Order? Positive to negative (e.g., strongly agree to strongly disagree).
Example Questions
1. How satisfied are you with the quality of our products?
- Very dissatisfied
- Somewhat dissatisfied
- Neutral
- Somewhat satisfied
- Very satisfied
2. How much did you enjoy the presentation?
- Disliked it a lot
- Disliked it somewhat
- Neither liked nor disliked it
- Liked it somewhat
- Loved it
Read More: How To Use Likert Scale in Online Surveys: Ultimate Guide
3. Rating Scale: For Quantifying Qualitative Experiences
The next example we have chosen for the best survey scale you must use is the good old rating scale. Beyond attitudes and experiential assessments, rating scale question examples prove to be essential. These scales request respondents to rate a specific attribute or experience, often from “very dissatisfied” to “very satisfied.”
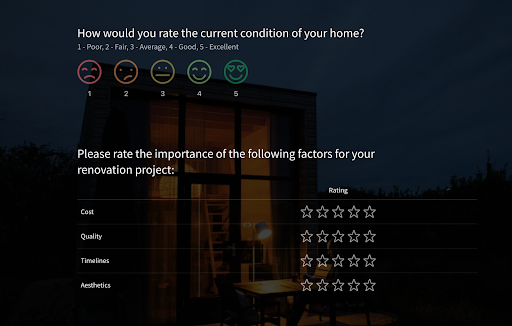
The practical application of rating scales in experience surveys allows businesses to quantify satisfaction levels, product usability, or the quality of service. They provide an objective data set that can guide business improvements, making them a valuable tool for assessing and improving customer experiences.
Key Features:
a. Continuous Measurement
Unlike the discrete options on a Likert scale, the rating scale offers a continuous measurement spectrum. Respondents can rate items on a scale with multiple points, allowing for a more nuanced understanding of their preferences or perceptions.
b. Varied Response Formats
The rating scale offers diverse response formats, ranging from numeric scales (e.g., 1 to 10) to semantic differential scales (e.g., “Very Satisfied” to “Very Dissatisfied”). This versatility enables survey creators to tailor the scale to suit their research objectives.
c. Measuring Intensity
One unique aspect of the rating scale is its ability to measure the intensity of respondents’ preferences or evaluations. For instance, a respondent may rate one item with a higher score, indicating a stronger preference, while another may receive a lower score, denoting a weaker preference.
d. Range of Applications
The rating scale’s adaptability makes it suitable for various research and survey scenarios. It can be utilized to gauge customer satisfaction, product preferences, and user experience or gather feedback on services and performance evaluations.
Where can it be used?
Movie reviews, Restaurant experience, Pain level, Course difficulty
Example Questions
- How would you rate the overall quality of the movie? (on a scale of 1-10)
- Please rate your pain level on a scale of 1 to 10, with 1 being no pain and 10 being the worst pain you can imagine.
- How satisfied were you with your dining experience?
Read more: 60+ Rating Scale Questions to Make Your Surveys Engaging
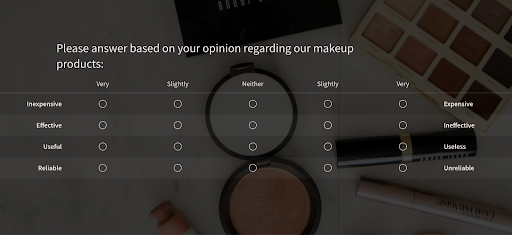
4. Semantic Differential Scale: Tapping into the Abstract
They come into play for capturing the subtle nuances of perceptions and sentiments. Unlike scales with a single descriptor, these scales offer two opposite adjectives at each end, allowing respondents to position their perception along this continuum.
Semantic Differential Scales provide valuable insights when understanding subjective attributes like brand perception, emotional responses, or personal preferences. They can reveal the unspoken and often overlooked aspects of a respondent’s experience or opinion.
Key Features:
a. Bipolar Adjectives
At the heart of the Semantic Differential Scale are the bipolar adjectives, which represent opposite meanings or emotional connotations. For example, “Good” and “Bad,” “Exciting” and “Boring,” or “Innovative” and “Obsolete” are paired to measure contrasting attitudes.
b. Intuitive Response Format
Respondents rate the items on the scale by marking a point between the paired adjectives that best reflect their impression. The intuitive format simplifies the survey-taking process, making it easy for participants to convey their feelings accurately.
c. Capturing Emotional Responses
It captures respondents’ emotional responses to the evaluated concepts or entities. It goes beyond basic Likert scales to delve into the emotions associated with attitudes and opinions.
RELATED READ: Emotional Branding: A Guide to Lasting Customer Relationships
d. Qualitative Insights
While the scale provides quantitative data through the distance between marked points and the scale’s midpoint, it also offers qualitative insights into respondents’ perceptions and associations with the evaluated items.
e. Subjective Dimension
It acknowledges the subjective nature of respondents’ attitudes and perceptions. It allows them to interpret and express their feelings based on their experiences and perspectives.
Read More: How To Measure Customer Feedback With Semantic Differential Scale
What can it be used?
Learning a new language, Movie reviews, Restaurant experience
Example Question
Please share the Movie Review:
- Entertaining | Neutral | Boring
- Confusing | Neutral | Clear
- Visually stunning | Neutral | Average visuals
Bonus!
It’s time to ditch the dull, outdated forms and questionnaires and engage your audience with conversational surveys that flow naturally, just like a chat. Perhaps SurveySparrow is the platform you are looking for!
Create engaging forms that will fetch you a 40% higher response rate. Plus, with the 1000+ pre-designed customizable templates, you will never have to break a sweat! If you still feel unmotivated, let the AI form builder do the work! And yes, you can create forms with all these survey scale examples and more.
Why don’t you take it for a spin today?

Explore Deeper Customer Insights with SurveySparrow
A personalized walkthrough by our experts. No strings attached!
Wrap Up!
Were these Survey Scale examples useful for you?
They aren’t just fancy options. They help us delve into the intricacies of human emotions and perceptions! Remember that the key lies in variety! Mix and match to understand your audience better.
Ready to cook up some amazing surveys?
Watch Customer Stories


