Survey & Feedback
How Expert Analysts Actually Extract Value from Survey Findings
Article written by Kate Williams
Content Marketer at SurveySparrow
15 min read
19 September 2025

Survey findings reveal more than just numbers—they uncover patterns, sentiments, and trends that drive smarter decisions. When analyzed properly, they help businesses turn feedback into focused action, using techniques like segmentation, cross-tabulation, and sentiment analysis.
Key Highlights:
- Clean your data before analyzing to avoid misleading results.
- Segment responses to identify patterns across different audience groups.
- Use cross-tabulation to uncover relationships between variables.
- Apply sentiment and thematic analysis to understand the “why” behind feedback.
- Visualize insights effectively using the right charts and colors.
- Focus on insights with high business impact to prioritize actions.
- Track ROI of survey decisions through engagement, revenue, and cost metrics.
Did you know that even a 5% response rate from higher education student surveys can produce reliable estimates when the sample size exceeds 500? This surprising fact challenges common assumptions about survey findings and their validity.
However, collecting responses is just the beginning. Survey analysis transforms raw data into actionable business insights through various analytical methods. In fact, your survey data analysis approach can make the difference between surface-level observations and deep, meaningful insights. Whether you're working with quantitative metrics or qualitative feedback, understanding how to properly analyze survey data is crucial for making informed decisions.
This comprehensive guide will show you exactly how expert analysts extract maximum value from their survey findings. You'll discover proven techniques for assessing data quality, identifying patterns, and creating impactful visualizations that tell the right story. Additionally, you'll learn how to transform your survey results into actionable recommendations that drive real business outcomes.
The Pre-Analysis Groundwork Expert Analysts Never Skip
Before any analysis begins, expert survey analysts perform crucial groundwork to ensure the findings they extract are reliable and actionable. This pre-analysis phase determines whether your survey data will yield valuable insights or misleading conclusions.
Assessing data quality and statistical significance
The foundation of meaningful survey analysis lies in understanding if your results are statistically significant. Statistical significance tells you whether your findings represent genuine patterns or merely random chance. With a standard 95% confidence level, a statistically significant result means there's less than a 5% probability that the observed difference occurred by chance alone.
Sample size dramatically influences statistical significance. Even with perfect methodology, a small sample creates a margin of error that affects your survey results. Therefore, experienced analysts use sample size calculators to verify their data pool is large enough to produce valid insights.
Many analysts mistakenly equate statistical significance with practical importance. A p-value below 0.05 doesn't necessarily indicate a strong relationship between variables—it merely suggests the null hypothesis is unlikely. Furthermore, large sample sizes can make even minor, meaningless differences appear statistically significant.
To truly assess significance, consider these key factors:
- P-value - The probability that results occurred by chance
- Effect size - The magnitude of the observed difference
- Sample composition - How well your sample represents the target population
- Confidence level - Typically set at 95%, meaning you're 95% confident in your results
Cleaning survey data: What to keep vs. what to discard
Raw survey data often contains "noise" that can skew your analysis if not properly cleaned. Data cleaning involves identifying and removing anomalous, incorrect, or otherwise problematic responses.
Table: Survey Data Cleaning Criteria
| What to Remove | Why It Matters | How to Identify |
|---|---|---|
| Incomplete responses | Can skew results and limit your ability to capture insights | Filter by completion status |
| Speeders | Indicates respondents didn't read questions carefully | Flag responses completed significantly faster than average |
| Straightliners | Shows respondents selected the same answer repeatedly without thought | Export to spreadsheet and look for identical answer patterns |
| Outliers | Extreme values that distort statistical analyzes | Look for values that fall well beyond normal ranges |
| Inconsistent responses | Indicates carelessness or dishonesty | Apply multiple filters to find contradictory answers |
| Nonsensical feedback | Adds no value to analysis | Review open-ended responses for gibberish text |
Before discarding data, save a complete copy of your original raw dataset. This allows you to backtrack if needed or enables others to replicate your analysis later. Similarly, document all cleaning steps taken, including rationales for each decision made.
Segmenting responses for deeper insights
Segmentation transforms good analysis into great analysis by revealing patterns that would otherwise remain hidden. Rather than analyzing all responses as a single group, segmentation helps you uncover how different audience segments answered the same questions.
First, determine which segments will provide meaningful insights. Common segmentation criteria include:
- Demographics (age, gender, location, occupation)
- Behaviors (buying patterns, usage frequency)
- Attitudes and values (beliefs, preferences)
- Customer status (new vs. repeat, loyalty level)
Cross-tabulation is particularly valuable for comparing relationships between variables across different segments. For instance, if you're analyzing product satisfaction, cross-tabulation might reveal that women under 30 have significantly different preferences than men over 50.
Be cautious, though, when slicing data too finely. Excessive segmentation creates smaller sample sizes within each group, potentially affecting the reliability of your segment-specific results.
Ultimately, effective segmentation enables you to tailor products, services, and marketing strategies to the unique needs of distinct customer groups. This targeted approach helps you identify profitable segments and develop more authentic connections with each group.
Transforming Raw Survey Data into Meaningful Patterns
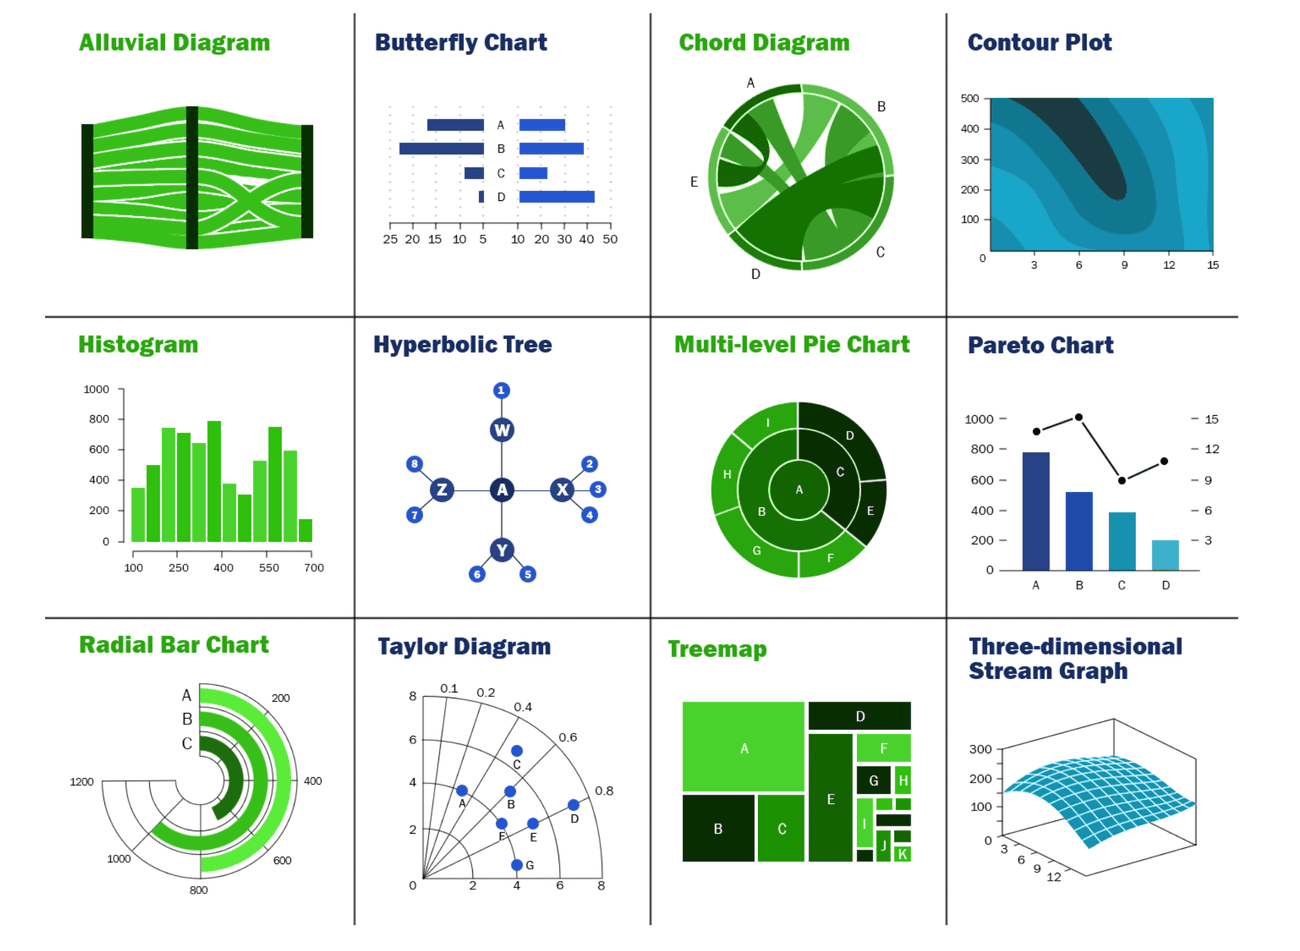
Image Source: Red Nucleus
After you've properly cleaned and segmented your data, the real analytical work begins. This is where you transform raw numbers into meaningful insights that drive decision-making. Let's explore the techniques expert analysts use to uncover valuable patterns in survey data.
Cross-tabulation techniques that reveal hidden connections
Cross-tabulation (or crosstabs) is one of the most powerful tools in a survey analyst's arsenal. This technique examines relationships between two or more variables, revealing connections that might remain invisible when looking at total survey responses.
When analyzing customer satisfaction survey data, I often use cross-tabulation to compare how satisfaction levels differ between new customers and those who have purchased before. This simple comparison frequently reveals actionable insights about onboarding processes or product expectations.
To create effective cross-tabs:
- Identify the specific relationship you want to examine
- Select categorical variables that can be divided into mutually exclusive groups
- Create a table showing the intersection of these variables
- Calculate percentages to identify meaningful patterns
For marketers, cross-tabulation provides invaluable insights by answering questions like "Is there a difference between men's and women's intent to purchase my brand?" or "Does age affect my brand awareness?". Educational institutions can use cross-tabs to evaluate how students in certain programs feel about resource availability.
Remember that each time you slice data through cross-tabulation, your sample size gets smaller, potentially affecting reliability. Balance your desire for granular insights with the need for statistical validity.
Identifying statistical outliers worth investigating
Statistical outliers—data points that fall significantly outside the typical range—can either provide breakthrough insights or completely distort your analysis. The challenge lies in determining which outliers matter and which should be excluded.
Traditionally, analysts identify outliers using:
- Visual methods: Box plots, histograms, and scatter plots can highlight unusual values
- Z-scores: Values beyond +/-3 from zero merit investigation when data follows normal distribution
- Interquartile range (IQR): Values beyond Q1-1.5×IQR or Q3+1.5×IQR
- Statistical tests: Methods like Grubbs' test can formally identify outliers
Once identified, deciding what to do with outliers requires careful consideration. Ask yourself: "Was this outlier caused by error?" If so, removal is typically justified. Alternatively, if the outlier represents a legitimate but rare response, keeping it might reveal valuable insights about emerging issues or opportunities.
As one survey analyst shared with me, "Sometimes the outlier is where the story begins, not where it ends." In healthcare surveys, for instance, outlier responses have revealed previously unknown medication side effects that warranted further investigation.
How to spot emerging trends across different question types
Identifying emerging trends across various question types requires both analytical rigor and creative thinking. Start by establishing baseline measurements of interests and preferences against which future insights can be compared.
To effectively spot trends:
Track responses over time: Regularly gathering answers to simple questions like preference ratings helps anticipate when trends are about to take off. For example, tracking customer awareness of new technologies can help determine which investments are worthwhile.
Apply thematic analysis: For open-ended responses, organize raw data into categories that group similar answers, even when worded differently. This approach transforms qualitative insights into quantitative data suitable for trend analysis.
Look for correlations: Examine how responses to different question types relate to each other. When satisfaction scores correlate with particular feedback themes, you've found a trend worth investigating.
Visualize data: Create time-series charts to spot upward or downward movements in key metrics. Visualizations often reveal patterns that remain hidden in raw data tables.
Market research is not just something you should do when launching new products—it should be at the heart of everything you do. By continuously monitoring trends and getting pre market listing data, you position yourself to respond appropriately to emerging developments in your industry.
Qualitative Analysis Techniques That Uncover the 'Why'
While quantitative data tells you what happened in your surveys, qualitative analysis reveals why it happened. Open-ended responses provide rich context that numbers alone cannot capture. I've found that extracting meaning from these unstructured responses often yields the most actionable insights for clients.
Text analysis methods for open-ended survey responses
Open-ended questions allow respondents to express themselves freely, uncovering considerations that predefined answers might miss. When analyzing thousands of open text responses, manual review becomes impractical. Instead, I rely on systematic text analysis methods to transform unstructured feedback into meaningful patterns.
The first step involves preparing text data by removing punctuation, spaces, and common "stop words" like "and" or "the" that carry no intrinsic meaning. Next, words are lemmatized to group all inflected forms together. From there, several techniques can be applied:
Word clouds display n-grams (word groupings) with font size proportional to frequency. While visually appealing, I've learned they're best used as a preliminary scanning tool rather than for deep analysis.
Thematic analysis organizes responses into categories that group similar answers, even when worded differently. This approach transforms qualitative insights into quantifiable data suitable for trend analysis. In practice, coding involves either a deductive approach (using predefined themes) or an inductive approach (letting themes emerge naturally).
Keyness analysis compares n-gram use between different groups using χ² test statistics. This helps identify terms that significantly differentiate one group's responses from another's.
Sentiment analysis: Going beyond positive and negative
Sentiment analysis determines whether text expresses positive, negative, neutral, or mixed emotions. Although simple in concept, accurate sentiment analysis requires nuanced understanding of context.
Traditional sentiment analysis tools might interpret mixed statements as neutral because positive and negative elements cancel each other out. More sophisticated approaches use natural language processing to weigh sentiment along a scale, considering grammar, context, and industry-specific terminology.
Aspect-based sentiment analysis (ABSA) takes this further by connecting sentiments to specific attributes mentioned in text. For instance, analyzing laptop reviews might reveal negative sentiments specifically about "processor speed" rather than the product overall. This granularity makes insights more actionable.
Combining qualitative and quantitative data for complete insights
Mixed methods research integrates qualitative and quantitative approaches to provide a more comprehensive understanding than either method alone. Consequently, you can explore both the "what" and "why" behind survey findings.
I've found that qualitative data adds essential context to quantitative metrics. For example, when NPS scores drop, open-ended responses often reveal exactly why customers' sentiment changed. Moreover, mixed methods allow you to test qualitative insights across broader audiences through quantitative validation.
One effective integration technique is creating joint displays—visual representations that simultaneously present quantitative and qualitative results. These displays help identify connections between statistical findings and thematic insights, generating new understandings beyond what either data type could provide independently.
Ultimately, the most valuable survey insights often emerge at the intersection of qualitative and quantitative analysis, revealing both patterns and their underlying causes.
Data Visualization Strategies That Tell the Right Story
Once you've uncovered meaningful insights from your data, presenting them effectively becomes your next challenge. In my experience analyzing numerous survey findings, I've found that visualization can either illuminate or obscure your message depending on how you approach it.
Choosing the right chart types for different survey findings
The right chart type can instantly communicate your survey insights, whereas the wrong one might confuse or mislead your audience. Bar charts remain the most versatile option for survey data, as researchers have found them significantly easier for people to comprehend than other visualization formats. I typically use vertical bar charts when comparing means or percentages between 2-7 different groups, and switch to horizontal bar charts when dealing with 8+ groups or long labels.
For showing distribution of a single variable, pie charts work well but only with limited categories (fewer than 6). As one expert notes, "Pie charts are best used when you are presenting a share of something, ideally items explaining a single variable to benefit readability and assessment". Line charts excel at displaying trends over time, making them ideal for tracking responses across multiple survey iterations.
Color psychology in survey results presentation
Colors aren't just decorative—they profoundly influence how your survey findings are perceived. According to research, people make a judgment about your content in 90 seconds or less, and up to 90% of that judgment is influenced by the colors they see.
In survey visualization, I've found these color principles particularly effective:
- Use color contrasts in background and font colors to enhance readability
- Employ intuitive color distributions where positive responses use green shades and negative ones use red
- Apply complementary color schemes for graphs and charts to make elements stand out
When designing satisfaction surveys, red typically signals bad experiences, green represents good ones, while blue provides a calming effect that symbolizes trustworthiness.
Interactive dashboards vs. static reports: When to use each
Interactive dashboards and static reports serve different purposes in survey result presentation. Through my work with clients, I've observed that static reports work well for providing "comprehensive, granular insights" and "high-level snapshots of what progress was made". They excel at showcasing specific key performance indicators without overwhelming audiences with excessive data.
In contrast, interactive dashboards offer direct user engagement through filters, drills, and data highlighting techniques. This interactivity brings significant advantages—notably time savings for dashboard creators since users can explore data independently.
Choose interactive dashboards when your audience needs to:
- Explore data on their own terms
- Filter information based on specific interests
- See the impact of adjusting variables on outcomes
Ultimately, as one analytics expert notes, "The decision between reports and dashboards depends on your specific data requirements". Your choice should align with your audience's needs and technical comfort level.
From Insights to Action: The Expert's Approach to Survey Findings
Gathering data is only half the battle in survey research. The real value emerges when you transform those insights into concrete actions. In my years of analyzing survey results, I've found that the most successful organizations follow three crucial steps after collecting their findings.
Prioritizing insights based on business impact
Successful analysts don't treat all survey insights equally. Instead, they systematically rank findings based on their potential business impact. The most effective approach is to align survey insights with key performance indicators (KPIs), ensuring that prioritized features directly contribute to business goals and objectives.
When working with a healthcare client, I implemented a feature prioritization framework that identified low-hanging fruits—features that could deliver significant value with minimal effort. We asked participants to rate potential features based on both expected impact and required implementation effort. This assessment ensured resources were allocated effectively.
For maximum effectiveness, consider these prioritization factors:
- Correlation with business goals
- Frequency of mention across respondents
- Urgency of implementation
- Resource requirements
Creating actionable recommendations from survey data
Turning survey data into specific recommendations requires both analytical skills and business acumen. First, analyze both quantitative and qualitative data to gain a comprehensive understanding of user preferences. Based on this combined analysis, assign a priority score to each potential action.
The opportunity gap survey methodology is particularly valuable here. This approach analyzes the gap between how important each insight is and how satisfied people are with current solutions. As one research professional explains, "The work you should prioritize are insights with a low level of satisfaction and a high level of importance".
Once priorities are established, create a product roadmap that reflects user needs while aligning with your business goals. Share findings and priorities with key stakeholders, ensuring transparency about decision-making criteria.
Measuring the ROI of survey-driven decisions
At this point, the million-dollar question becomes: Did our survey-driven decisions actually deliver value? To answer this, establish metrics that demonstrate return on investment.
In my experience, effective ROI measurement for survey implementation requires tracking several key indicators:
- Revenue growth: Track metrics like customer lifetime value (CLV) or units sold
- Cost savings: Monitor reduced support tickets or decreased product returns
- Customer engagement: Follow NPS trends, repeat purchase rates, and retention metrics
Essentially, surveys themselves become motivators for participation, as demonstrated through increased response rates over time . The ultimate goal is creating continuous feedback loops that inform decisions, which one expert describes as "a great tool for achieving collaboration that helps leaders use data for evidence-based decisions" .
Conclusion
Survey analysis demands more than just collecting responses - it requires careful attention to detail and expert techniques to uncover meaningful insights. Throughout this guide, you've learned proven methods that transform raw data into actionable business decisions.
Expert analysts consistently demonstrate that proper groundwork, including statistical validation and thorough data cleaning, builds the foundation for reliable insights. Pattern identification through cross-tabulation and trend analysis reveals hidden connections within your data. Qualitative analysis techniques help explain the "why" behind your numbers, while thoughtful visualization choices make your findings clear and compelling.
Remember these key takeaways:
- Statistical significance matters, but practical importance matters more
- Segment your data strategically to uncover deeper insights
- Combine qualitative and quantitative analysis for complete understanding
- Choose visualization methods that match your message
- Prioritize findings based on business impact
Ready to put these expert techniques into practice? SurveySparrow offers powerful tools that make implementing these analytical approaches straightforward and efficient. The platform's intuitive interface helps you focus on extracting insights rather than wrestling with complex software.
Your survey analysis journey doesn't end here - it evolves with each new dataset and business question. Keep refining your approach, stay curious about patterns in your data, and always connect findings to concrete actions. Success comes from consistently applying these expert methods while remaining open to discovering unexpected insights along the way.

Create engaging surveys that people actually complete. Try SurveySparrow now!
Kate Williams
Frequently Asked Questions (FAQs)
The main steps include assessing data quality, cleaning the data, segmenting responses, identifying patterns through techniques like cross-tabulation, and combining qualitative and quantitative analysis for comprehensive insights.
To ensure statistical significance, consider factors such as p-value, effect size, sample composition, and confidence level. Use sample size calculators to verify your data pool is large enough to produce valid insights.
Choose chart types based on the data you're presenting. Bar charts work well for comparing groups, pie charts for showing distribution (with limited categories), and line charts for displaying trends over time. Consider color psychology and whether to use interactive dashboards or static reports based on your audience's needs.
Use text analysis methods such as thematic analysis to categorize similar responses, sentiment analysis to gage emotions, and aspect-based sentiment analysis to connect sentiments to specific attributes. Combining these qualitative insights with quantitative data often yields the most valuable findings.
Prioritize insights based on their potential business impact, aligning them with key performance indicators. Create a product roadmap that reflects user needs while considering factors like implementation effort. Measure the ROI of survey-driven decisions by tracking metrics such as revenue growth, cost savings, and customer engagement.
Related Articles

Survey & Feedback
How Can Survey Platforms Be Used in Real Estate Practices?
9 MINUTES
15 April 2020

Survey & Feedback
Customer Exit Survey: Questions, Template, and Best Practices
8 MINUTES
18 April 2022

Survey & Feedback
Identify Population of Interest: Key Concepts and Examples
13 MINUTES
28 September 2023

Survey & Feedback
Conversational UX: Why Survey Bots Outperform Static Forms in Today's Market
6 MINUTES
24 December 2025
