
You've decided to run a survey. Your population is large — thousands of customers, employees, or students — and surveying everyone isn't realistic. So you need a sample.
But which sampling method gives you results you can actually trust?
Two of the most widely used probability sampling techniques are simple random sampling and stratified sampling. At a glance, they seem similar — both are random, both are scientifically valid, and both are widely taught in research methods courses. But they serve different purposes, and choosing the wrong one can quietly undermine the accuracy of your entire study.
This guide breaks down exactly what each method is, how they differ, when to use which, and how to apply them in real survey research — including how modern market research tools handle all of this for you automatically.
What is Simple Random Sampling?
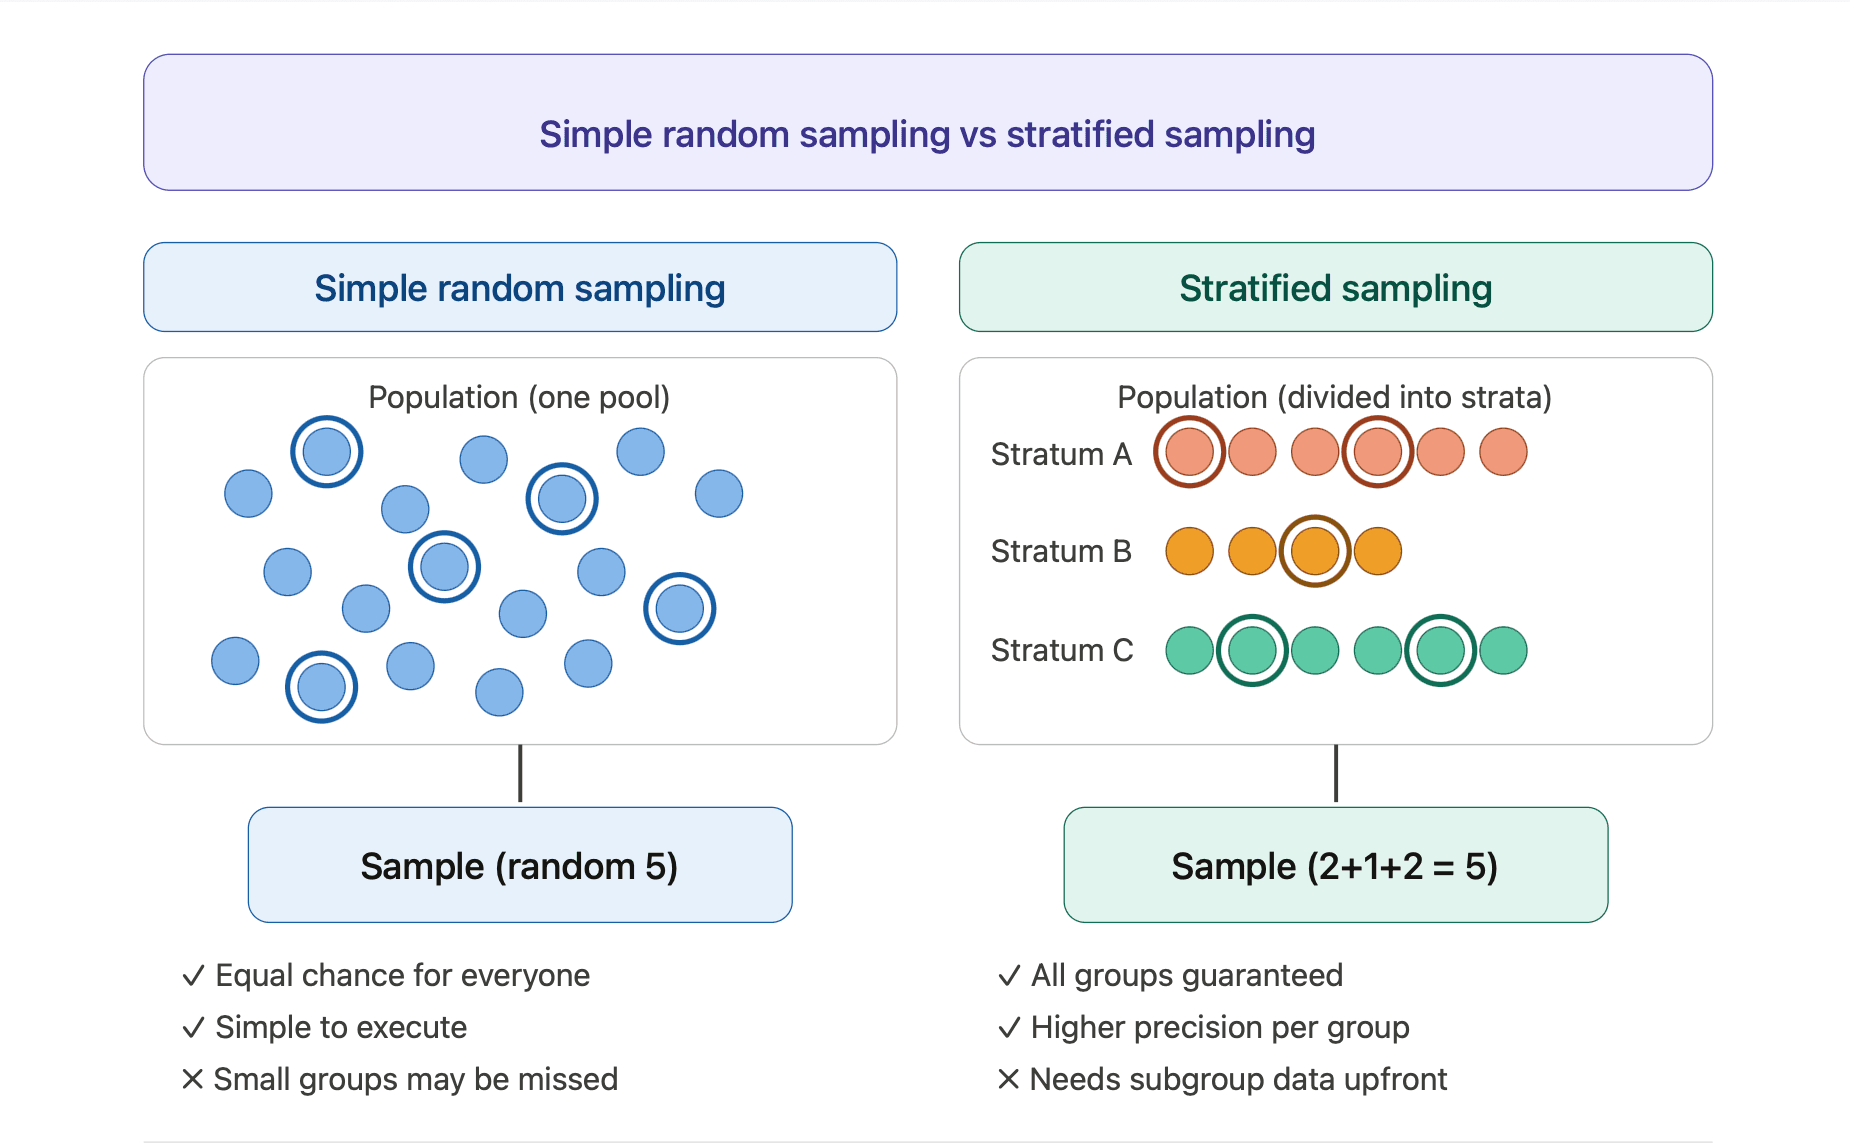
Simple random sampling (SRS) is the most foundational probability sampling method. Every individual in your target population has an equal and independent chance of being selected for the sample.
Think of it like a lottery: all names go into one pool, and winners are drawn at random. No groups, no structure, no preference.
How it works
- Define your population (e.g., all 5,000 employees at a company)
- Assign each individual a unique number
- Use a random number generator or lottery draw to select your sample
- Survey those selected
Quick example
A university wants to survey 200 of its 4,000 students about campus Wi-Fi quality. Using simple random sampling, they assign each student a number (1–4,000) and use a random number generator to select 200. Every student — freshman or senior, engineering or arts — has the same 5% chance of being picked.
When simple random sampling works well
- Your population is relatively homogeneous (members are similar to each other)
- You have access to a complete, accurate list of the population
- The characteristic you're measuring doesn't vary significantly across subgroups
- Your sample size is large enough to naturally represent any subgroups present
Limitations
- Underrepresentation risk: Small subgroups can be missed by chance. In the university example above, international students make up only 3% of enrollment — with SRS, you might end up with just 4–6 of them in your 200-person sample, making their responses statistically unreliable.
- Requires a complete sampling frame: You need a full list of every population member, which isn't always available.
- Less efficient for heterogeneous populations: When subgroups differ significantly, SRS may require larger sample sizes to capture that variation.
What is Stratified Sampling?
Stratified sampling divides the population into distinct subgroups — called strata — before sampling. Individuals within each stratum share a common characteristic (age bracket, department, region, gender, purchase tier, etc.), and a random sample is then drawn from each stratum separately.
The key difference from SRS: you're not drawing from one pool. You're drawing from multiple pools, ensuring each subgroup gets representation.
Two types of stratified sampling
Proportional stratified sampling: Each stratum contributes to the sample in proportion to its size in the population.
Example: If women make up 60% of your customer base and men 40%, your sample would be 60% women and 40% men.
Disproportional (or equal) stratified sampling: Each stratum contributes an equal number of respondents, regardless of its actual size — used when you need to analyze small subgroups with equal statistical power.
Example: You want to compare satisfaction scores across 5 geographic regions equally, even though Region 5 has only 3% of your customers.
How it works
- Define your population and identify the key stratification variable (age, region, job level, etc.)
- Divide the population into non-overlapping strata
- Determine sample size per stratum (proportional or equal)
- Apply simple random sampling within each stratum
- Combine all stratum samples into your final dataset
Quick example
The same university wants to survey 200 students about campus Wi-Fi — but this time they want results that are comparable across year groups. The student body is 30% freshmen, 28% sophomores, 22% juniors, and 20% seniors. Using proportional stratified sampling, they'd survey 60 freshmen, 56 sophomores, 44 juniors, and 40 seniors.
When stratified sampling works well
- Your population has meaningful subgroups that you want to analyze separately or compare
- You expect the subgroups to respond differently to your survey questions
- Some subgroups are small but important (e.g., a minority customer segment whose feedback you can't afford to miss)
- You want to reduce sampling error and achieve greater statistical precision
Simple Random Sampling vs Stratified Sampling: Side-by-Side Comparison
| Dimension | Simple Random Sampling | Stratified Sampling |
|---|---|---|
| How selection works | Every individual drawn from one pool | Population divided into strata; random sample drawn from each |
| Subgroup representation | Chance-based; small groups may be missed | Guaranteed by design |
| Required information | Complete list of all population members | Complete list + known subgroup membership |
| Best for | Homogeneous populations | Heterogeneous populations with meaningful subgroups |
| Statistical precision | Lower for varied populations | Higher — especially for within-group analysis |
| Complexity | Low | Medium |
| Risk of bias | Low, but small groups may be under-represented | Very low when strata are well-defined |
| Sample size needed | Often larger | Often smaller for equivalent precision |
| Analysis flexibility | Overall population estimates | Both overall and subgroup-level estimates |
Key Differences Explained
1. How representation is handled
This is the most important practical difference. Simple random sampling relies on chance to represent subgroups. If your population is mostly homogeneous, this works fine. If it's diverse, small but important subgroups can be accidentally excluded or undersampled.
Stratified sampling guarantees representation by design. You decide upfront which characteristics matter for your research and build them into the sampling architecture.
2. Statistical efficiency
For a given sample size, stratified sampling typically produces estimates with lower variance (margin of error) than simple random sampling — but only when the strata are genuinely different from each other on the variable being measured.
If your strata are actually very similar to each other (i.e., stratifying by a variable that doesn't correlate with your outcome), you get no efficiency gain. In that case, SRS is simpler with no accuracy cost.
Rule of thumb: The more the strata differ from each other internally, the greater the efficiency advantage of stratified sampling.
3. What you can do with the data
Simple random sampling gives you reliable estimates for the overall population.
Stratified sampling gives you reliable estimates for the overall population and each individual stratum. If you want to compare satisfaction scores between departments, or purchase intent between age groups, stratified sampling is built for that kind of analysis.
This is where a proper research platform makes a significant difference. SurveySparrow's market research software lets you filter and segment responses by audience traits or behavior directly in the reporting dashboard — so you can slice stratified data by region, customer tier, demographic group, or any custom variable without touching a spreadsheet.
4. Complexity and resources
Simple random sampling is easier to execute — you need a list and a randomizer, nothing more.
Stratified sampling requires additional upfront work: you must know your strata, have subgroup membership data for every population member, and plan your allocation. For large, well-documented populations (HR databases, CRM systems), this is straightforward. For populations where subgroup data is unavailable, it may be impractical.
When to Use Simple Random Sampling
Choose simple random sampling when:
- Your population is fairly uniform. If you're surveying employees at a company where roles, seniority, and locations are broadly similar, SRS will give you solid results without the overhead of stratification.
- You don't need subgroup analysis. If you only care about an overall score (e.g., overall NPS), not about how different departments score, there's no need to stratify.
- You don't have subgroup data. If your list of population members doesn't include demographic or segmentation information, you can't stratify — SRS is your best option.
- Speed and simplicity matter. Quick pulse surveys, exploratory research, and situations where you need results fast benefit from SRS's low setup time. SurveySparrow's automated reporting means you can go from survey close to decision-ready insight in hours, not weeks.
- Your sample size is large. With a very large sample, natural variation in the random draw tends to produce representative results across most subgroups anyway.
When to Use Stratified Sampling
Choose stratified sampling when:
- You need to compare across subgroups. Employee satisfaction by department, customer sentiment by region, student feedback by year — any analysis that requires reliable subgroup estimates demands stratification.
- Some subgroups are small but critical. If a minority subgroup's opinions are particularly important (e.g., high-value customers who make up 5% of your base), stratification ensures you get a statistically usable sample from them.
- The subgroups respond very differently. If you expect wide variation between groups, stratification dramatically reduces sampling error and produces more efficient estimates.
- You're doing market research with conjoint or MaxDiff analysis. These advanced techniques — which SurveySparrow's market research platform supports natively — require balanced segment representation to produce valid preference simulations. Running a conjoint study on an unbalanced SRS sample can distort willingness-to-pay estimates significantly.
- You're doing HR surveys or DEI research. Ensuring proportional or equal representation of demographic groups (gender, ethnicity, role level) is both statistically and ethically important.
- Your population is highly heterogeneous. Large customer databases, national surveys, multi-department organizations — these almost always benefit from stratification.
Practical Survey Examples
Example 1: Customer satisfaction survey (stratified)
Scenario: An e-commerce company wants to measure CSAT across its customer base of 50,000 people. Customers are categorized as: new (purchased in the last 30 days, 15% of base), returning (2–5 purchases, 55%), and loyal (6+ purchases, 30%).
With SRS: A 500-person random sample would yield roughly 75 new customers, 275 returning, and 150 loyal — but with meaningful variance across draws.
With stratified sampling: You guarantee 75 new, 275 returning, and 150 loyal customers, giving you a reliable segment-level CSAT score for each group. This is where insights become actionable — you might find that new customers have significantly lower CSAT, pointing to an onboarding gap that wouldn't surface clearly from an aggregate SRS result.
How SurveySparrow helps: The platform's crosstab analysis lets you uncover hidden patterns and opinion shifts across these exact customer segments. Pair that with Key Driver Analysis — which plots how each factor's performance and importance impact your core metric — and you can quickly identify what's driving low satisfaction among new customers specifically, not just across the board.
Best choice: Stratified sampling.
Example 2: Product feature prioritization (stratified + MaxDiff)
Scenario: A SaaS company is deciding which new features to build next. They have three customer segments: SMB (60%), mid-market (30%), and enterprise (10%). They want to know which features matter most — and whether priorities differ by segment.
With SRS: You'd likely undersample enterprise customers (only ~50 in a 500-person sample), making any enterprise-specific conclusions unreliable.
With stratified sampling + MaxDiff: You oversample enterprise to 100 respondents, giving each segment a statistically comparable sample. MaxDiff analysis — where customers pick their most and least preferred feature from each set — then reveals the true priority ranking per segment. Enterprise customers may rank security integrations first; SMB customers may rank ease of onboarding.
How SurveySparrow helps: SurveySparrow's market research platform includes MaxDiff natively. It lets you present feature combinations to respondents and automatically rank what truly matters — eliminating weak ideas and focusing your roadmap on what each segment actually values, not what they say they do on a linear scale.
Best choice: Stratified sampling with MaxDiff analysis.
Example 3: Pricing research (stratified + conjoint analysis)
Scenario: A consumer electronics brand is launching a new phone and needs to find the right price point across its two key buyer profiles: budget-conscious buyers (under $400) and premium buyers ($400–$800).
With SRS: A general random sample gives you a price elasticity estimate for "the average customer" — which may not accurately represent either segment.
With stratified sampling + conjoint analysis: You build equal strata for both segments and run conjoint analysis — asking respondents to choose between phone configurations that vary on storage, camera, charging, and price. The simulator then models what trade-offs each segment is willing to make, and at what price point demand drops off.
How SurveySparrow helps: SurveySparrow's Pricing Analysis tools — including Van Westendorp and Gabor-Granger models — let you find the pricing sweet spot for each segment separately. You get confident pricing decisions backed by data, not guesswork, and the ability to test multiple price scenarios before committing to a launch price.
Best choice: Stratified sampling with conjoint and pricing analysis.
Example 4: Academic research on student study habits (SRS)
Scenario: A researcher at a 3,000-student college wants to study how many hours per week students study. They just need a general estimate — no breakdown by major or year.
With SRS: Simple and effective. A 300-person random sample gives a solid estimate of the average studying hours across the student body.
Best choice: Simple random sampling — the population is relatively uniform for this particular question, and no subgroup analysis is needed.
How to Apply These Methods
Whether you're using simple random sampling or stratified sampling, the survey instrument and distribution strategy need to match your sampling approach. SurveySparrow's market research platform is built around a three-stage workflow: Design → Distribute → Decide.
Design
Use expert-built research templates or a custom builder to create surveys that respondents actually want to complete. SurveySparrow's chat-style, mobile-first format drives 40% higher response rates than traditional form-based surveys — which matters especially for stratified studies where you need to hit quota in every stratum.
For stratified sampling in particular:
- Use logic branching to route respondents through stratum-appropriate question paths
- Tag responses by stratum at the point of collection so analysis is clean
- Set response quotas per stratum to ensure you hit your target numbers from each group before closing the survey
Distribute
SurveySparrow supports omnichannel distribution — email, WhatsApp, SMS, QR code, embed, and web link — so you can reach each stratum through the channel they're most likely to respond on. Enterprise customers via email, mobile users via WhatsApp, in-store shoppers via QR code.
For simple random sampling: a single distribution link randomizes naturally across your population.
For stratified sampling: use separate distribution links per stratum, with response quotas set for each, so the platform automatically closes collection for a stratum once the target is hit.
Note: SurveySparrow's Audience Panels feature will let you recruit pre-screened, verified respondents directly from inside the platform — enabling precise stratified sampling without needing to build your own sampling frame. Ideal for niche B2B segments or hard-to-reach demographics.
Decide
This is where SurveySparrow's market research platform really separates itself. Instead of exporting data to a spreadsheet, you get:
- Automated reports — ready immediately when the survey closes, no manual data wrangling
- Filter and segment by audience traits or behavior — slice results by any stratification variable
- Key Driver Analysis — plots each factor's performance and importance against your core metric, showing you what to fix first
- Correlation analysis — scans relationships across all response variables to spot what moves together
- Crosstab analysis — reveals hidden patterns and opinion shifts across your strata
- Conjoint and MaxDiff — for advanced preference and prioritization research
- Pricing models — Van Westendorp and Gabor-Granger for pricing research
- Push to BI tools, CRM, or any platform — seamless integrations so insights reach the people who need to act on them
All of this is GDPR, HIPAA, and SOC2 compliant — enterprise-grade security built in, not bolted on.
Common Mistakes to Avoid
1. Stratifying on irrelevant variables Stratification only improves precision when the variable you stratify on actually correlates with your outcome. Stratifying customers by first name initial, for instance, adds complexity with zero benefit.
2. Assuming SRS always "averages out" With small samples, SRS can produce unrepresentative results even if theoretically unbiased. If your subgroups matter — especially for market research decisions like pricing or product features — don't rely on chance.
3. Overlapping strata Each population member must belong to exactly one stratum. If a respondent could be classified in two strata, your design has a flaw.
4. Ignoring non-response bias Neither SRS nor stratified sampling protects you from non-response bias. If certain groups systematically don't respond, your results will be skewed regardless of sampling method. SurveySparrow's multi-channel distribution and higher engagement rates help minimize this problem — but it's worth monitoring response rates per stratum actively.
5. Forgetting to weight stratified data for overall estimates If you used disproportional stratified sampling (oversampling a small group), you must apply statistical weights when calculating overall population estimates. Raw averages from a disproportional sample will misrepresent the population. SurveySparrow's analytics handle segment-level reporting cleanly — but always flag this when presenting roll-up numbers to stakeholders.

Explore how SurveySparrow can transform your feedback process.
TRUSTED BY BEST-IN-CLASS BRANDS


Quick Decision Guide
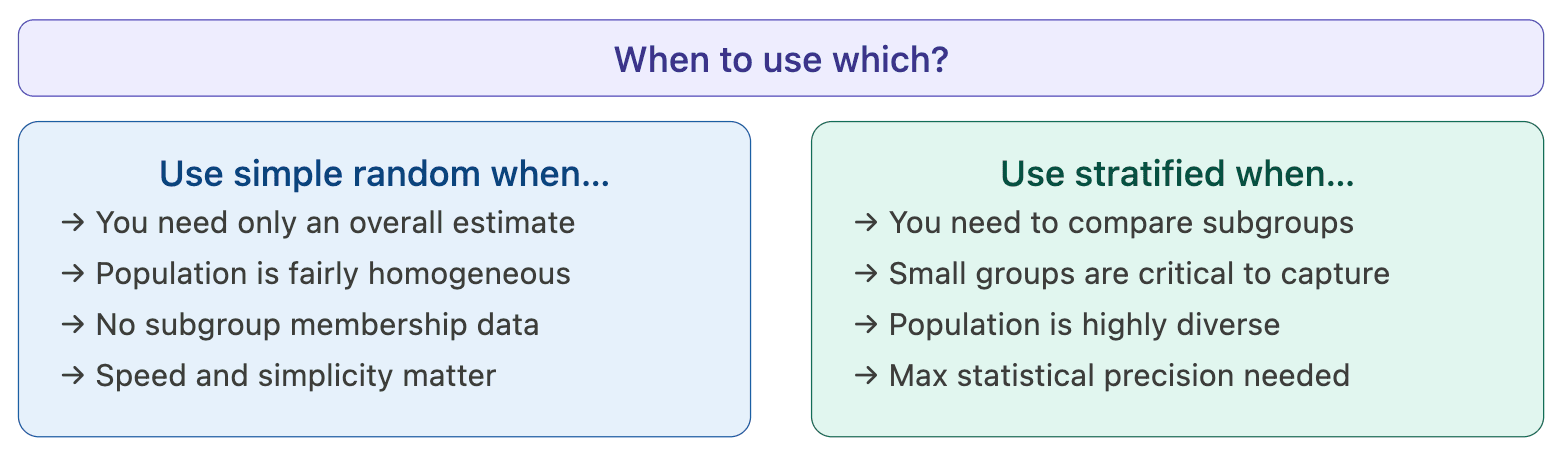
Use simple random sampling if:
- You only need an overall population estimate
- Your population is fairly homogeneous
- You don't have subgroup membership data
- Speed and simplicity are priorities
Use stratified sampling if:
- You need to compare or analyze subgroups
- Some subgroups are small but important
- Your population is diverse across a meaningful characteristic
- You're running conjoint, MaxDiff, or pricing analysis
- You want maximum statistical efficiency from your sample size
Ready to run your next research study with the right sampling approach and the right tools? SurveySparrow's market research platform handles everything from survey design to segment-level insights — so your decisions are faster, smarter, and backed by data you can trust.


![Sampling Methods: Types, Techniques & Examples [2026]](/_next/image/?url=https%3A%2F%2Fsurveysparrow.com%2Fwp-content%2Fuploads%2F2023%2F10%2Fsampling-methods.png&w=3840&q=75 "Sampling Methods: Types, Techniques & Examples [2026]")


