")
You spent weeks perfecting your survey questions. Then you sent it to 5,000 people and got 47 responses.
That 0.94% response rate? It's not your questions. It's how you distributed the survey.
Most companies still blast surveys via email like it's 2015. Meanwhile, SMS gets 98% open rates. Conversational surveys get 4x higher completion. QR codes bridge the gap between physical and digital seamlessly.
The survey distribution method you choose matters more than the questions you ask. Choose wrong, and even perfect surveys flop. Choose right, and mediocre surveys outperform.
This guide covers 12 survey distribution methods with real response rates, costs, and when to use each one.
What Are Survey Distribution Methods?
Survey distribution methods are the channels and techniques used to deliver surveys to respondents and collect their responses. These methods determine how your questionnaire reaches people—whether through email, SMS, QR codes, websites, social media, phone calls, in-app prompts, or other platforms. The distribution method directly impacts response rates, cost, speed, and data quality.
Types of Survey Distribution Methods
- Email surveys
- SMS/Text message surveys
- QR code surveys
- Website pop-up or embedded surveys
- Social media surveys
- In-app surveys
- Direct mail surveys
- Phone/IVR surveys
- In-person or kiosk surveys
- Panel/community surveys
- Conversational surveys
- Partner or affiliate surveys
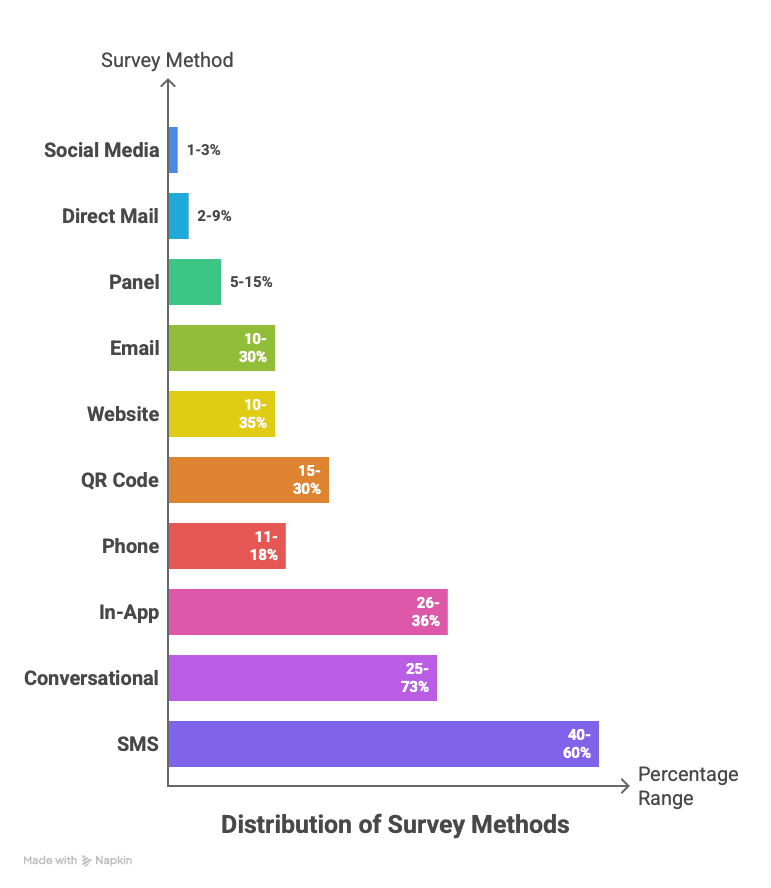
Why it matters: The same survey sent via different methods gets wildly different results.
- SMS: 40-60% response rate
- Email: 10-30% response rate (up to 48% with personalization)
- Social media (unpaid): 1-3% response rate
That's a 20-60x difference based solely on how you distribute.
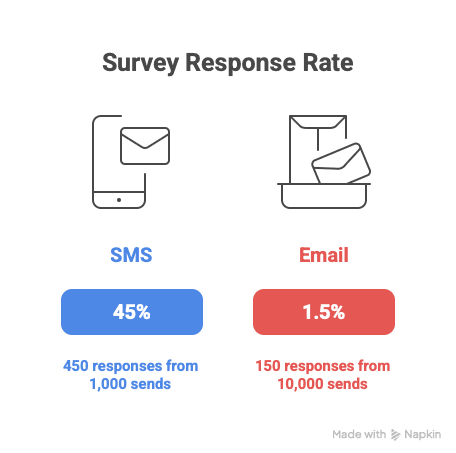
A decent survey via SMS to 1,000 opted-in customers (450 responses at 45%) beats a perfect survey emailed to 10,000 people who rarely check their inbox (150 responses at 1.5%).
12 Survey Distribution Methods Compared
1. Email Survey Distribution
Still the most common method, but effectiveness varies wildly.
Response rates: 10-30% average, up to 40-48% with personalization and incentives
Best for: B2B audiences, detailed surveys, existing customer feedback
Cost: Low ($0.01-$0.10 per send)
Pros:
- Easy to personalize and track
- Works for longer surveys
- Low cost per send
Cons:
- Average 20% open rate
- Spam filters catch surveys
- Slow response times
When it works: Subject line "Sarah, 2 questions about your order" gets 35% opens. Generic "We need your feedback" gets 5%.
Send Tuesday-Thursday, 10 AM-2 PM for B2B. Tuesday-Thursday, 7-9 PM for consumer.
2. SMS/Text Survey Distribution
Highest engagement of any channel.
Response rates: 40-60%, with 98% open rates
Best for: Quick surveys (1-5 questions), mobile audiences, time-sensitive feedback
Cost: Medium ($0.05-$0.15 per message)
Pros:
- 98% open rate
- 90% of responses within 3 minutes
- Works on all phone types
Cons:
- Limited to 160 characters
- Requires opt-in (TCPA compliance)
- Only works for short surveys
When it works: Restaurant chain got 8% response via email surveys. Switched to SMS sent 2 hours after visit: "How was your meal at [Location]? 2 quick questions: [link]" = 52% response.
Send between 10-11 AM or 6-7 PM. Never before 9 AM or after 9 PM.
Quick Survey Distribution Comparison
| Method | Avg Response Rate | Cost | Speed | Best For |
|---|---|---|---|---|
| SMS | 40–60% | Medium | Fast | Quick mobile feedback |
| 10–30% | Low | Medium | B2B & existing customers | |
| In-App | 26–36% | Medium | Real-time | SaaS & mobile apps |
| Conversational | 25–73% | Medium | Real-time | High engagement |
| QR Code | 15–30% | Low | Instant | Retail & events |
3. QR Code Survey Distribution
Post-pandemic favorite for bridging physical and digital.
Response rates: 15-25% scan rate
Best for: Retail feedback, restaurants, events, product packaging
Cost: Low (printing only)
Pros:
- Frictionless (no typing URLs)
- Captures immediate feedback
- Trackable
Cons:
- Requires physical presence
- Can't follow up easily
- Some older users unfamiliar
When it works: Coffee shop put QR codes on receipts: "Scan for free pastry if you complete our 30-second survey."
- Counter placement: 4% scan rate
- Receipt with incentive: 28% scan rate
- Table tents (customers waiting): 35% scan rate
Make QR codes at least 2x2 inches. Black on white background. Test on both iPhone and Android.
4. Website Embedded Surveys
Pop-ups and embedded surveys capture in-the-moment feedback.
Response rates: 10-35% depending on placement
Best for: UX research, e-commerce, content feedback, SaaS features
Cost: Low (platform fee only)
Pros:
- Contextual (catch users during experience)
- No contact info needed
- Real-time feedback
Cons:
- Can annoy users
- Limited to website visitors
- May hurt conversion if intrusive
When it works: SaaS company added exit-intent survey on pricing page: "Before you go—what's holding you back from signing up?" with 3 checkboxes.
18% of exiting users responded. Revealed the issue wasn't price—it was unclear plan differences. They fixed the comparison table. Conversions increased 23%.
Trigger exit-intent surveys after 30+ seconds, not immediately. Make them easy to close.
5. Social Media Survey Distribution
Broad reach but low engagement.
Response rates: 1-20% depending on paid vs organic
Best for: Brand research, consumer insights, younger demographics
Cost: Low-medium (free organic, $0.50-$3 per response paid)
Pros:
- Massive potential reach
- Can target demographics
- Native poll features
Cons:
- Very low organic reach (1-3%)
- Hard to control sample
- Platform polls are limited
When it works: LinkedIn for B2B, Instagram for consumer/young demos, Facebook for broad consumer.
Skincare brand posted Instagram survey link in bio: 0.4% click-through.
Same brand used Instagram Story poll "Which skincare concern bothers you most?" + swipe-up to detailed survey + $100 giveaway: 12% engagement, 847 completions.
6. In-App Survey Distribution
For mobile apps and SaaS products.
Response rates: 26-36% average when contextually triggered, up to 50% in optimal scenarios
Best for: App UX, feature feedback, SaaS satisfaction, gaming
Cost: Medium (development + platform)
Pros:
- Highly contextual
- High engagement when well-timed
- No external links needed
Cons:
- Limited to app users
- Can disrupt experience
- Requires developer resources
When it works: Meditation app showed survey after 7 days: "You've meditated 7 days in a row! 🎉 What time works best for you?" with 3 options.
42% completion. Learned 68% prefer mornings. Rebuilt notifications around this. Retention increased 31%.
Trigger after positive actions (purchase, achievement), not after errors. Keep to 1-3 questions max.
7. Direct Mail Surveys
Old school, but works for specific audiences.
Response rates: 2-9% average, up to 17-21% with cash incentives ($1-5)
Best for: 65+ demographics, high-value customers, when you have house lists
Cost: High ($2-$5 per piece)
Pros:
- Reaches people who ignore digital
- Feels official
- No spam filters
Cons:
- Expensive
- Slow (2-4 weeks)
- Manual data entry
When it works: Healthcare system surveyed 70+ patients. Email: 4% response. Direct mail with $2 cash, paper + QR code option, prepaid envelope: 19% response (significantly better than email for this demographic).
Include $1-5 cash to increase response 17-21% range (reciprocity psychology).
8. Phone/IVR Surveys
Personal with scalability.
Response rates: 11-18% average (higher with multiple follow-ups)
Best for: Complex surveys, older demographics, healthcare, political polling
Cost: High ($5-$15 per completion)
Pros:
- Can clarify complex questions
- Reaches non-internet users
- Real-time quality control
Cons:
- Expensive
- People screen unknown numbers
- Time-consuming
When it works: Auto dealership used IVR 24 hours after service. 5 questions on 1-5 scale, option to speak to manager if under 3.
31% response rate. Identified service issues. Customer satisfaction improved 12% in 3 months.
9. In-Person/Kiosk Surveys
Point-of-experience feedback.
Response rates: 10-70% (higher when staff-administered)
Best for: Retail, restaurants, events, healthcare waiting rooms, airports
Cost: Medium-high (equipment + maintenance)
Pros:
- Immediate feedback
- Fresh experience
- Reach customers without contact info
Cons:
- Requires infrastructure
- People in rush skip
- Hygiene concerns
When it works: Airport kiosks near gates: "30 seconds, win free flight."
- Random hallway: 8%
- Near gates (15+ min waits): 34%
- With "fast-track security" incentive: 47%
10. Panel/Community Surveys
Pre-recruited respondents.
Response rates: 5-15% for general panels, higher for dedicated opt-in panels
Best for: Market research, specific demographics, volume needs
Cost: High ($5-$20 per completion for general panels, $20-50+ for specialized)
Pros:
- Predictable response rates
- Precise targeting
- Fast (hours to days)
Cons:
- Expensive
- Professional respondents may game it
- Not your actual customers
When it works: Electronics company needed tech-savvy millennial feedback on prototype. Rented panel access (age 25-35, income $75k+, bought 3+ electronics recently).
500 qualified responses in 48 hours, $4,500 cost. Feedback informed $2M product decision.
11. Conversational Survey Distribution
The future. Chat-style surveys with 3-4x higher completion.
Response rates: 25-73% (averaging 40-50%), 3-4x higher than traditional surveys
Best for: All audiences, qualitative feedback, mobile users
Cost: Medium (platform subscription)
Pros:
- Feels natural, not like work
- 3-4x higher completion vs traditional
- Works on any device
- Richer qualitative data
Cons:
- Requires conversational platform
- More complex setup
Traditional surveys overwhelm people—15 questions stacked vertically on one page. Conversational surveys show one question at a time, like texting.
E-commerce company switched from traditional to conversational:
Traditional: All 10 questions visible, 12% completion, 4 minutes average, rushed responses
Conversational: One question at a time, 48% completion, 3 minutes average, thoughtful responses
Same questions. 4x better completion.
This is where SurveySparrow's SmartReach excels.
SmartReach uses conversational AI to distribute surveys across any channel—email, SMS, web, social, in-app—with 4x higher completion rates.
How SmartReach works:
- Questions appear one-by-one like a conversation
- Adapts based on previous answers
- Mobile-optimized for thumbs, not keyboards
- Multi-channel: Deploy via email, SMS, web embed, WhatsApp
- Real-time analytics
14-day free trial • Cancel Anytime • No Credit Card Required • No Strings Attached
12. Partner/Affiliate Distribution
Tap into established audiences.
Response rates: 5-30%
Best for: New audience reach, industry research, benchmarking
Cost: Low-medium (trade value)
Pros:
- Access audiences you don't own
- Third-party credibility
- Cost-effective
Cons:
- Less control
- Coordination required
- May need to share data
When it works: HR software partnered with HR association for "State of Remote Work 2026" survey. Company provided platform, association distributed to 50,000 members.
6,800 responses in 2 weeks. Both published report. Company got 230 leads. Association provided member value.
Quick Comparison: Survey Distribution Methods
| Method | Response Rate | Cost | Speed | Best For |
|---|---|---|---|---|
| 10-30% | Low | Medium | B2B, existing customers | |
| SMS | 40-60% | Medium | Fast | Quick surveys, mobile users |
| QR Code | 15-30% | Low | Instant | Retail, events, in-person |
| Website | 10-35% | Low | Real-time | UX feedback, e-commerce |
| Social | 1-3% organic, up to 20% paid | Low-Med | Medium | Brand research, young demos |
| In-App | 26-36% avg, up to 50% | Medium | Real-time | Apps, SaaS, games |
| Direct Mail | 2-9% (17-21% with incentive) | High | Slow | 65+, house lists |
| Phone | 11-18% | High | Medium | Complex surveys, older demos |
| Kiosk | 10-40% avg, up to 85% on-site | Med-High | Instant | Retail, hospitality, events |
| Panel | 5-15% general | High | Fast | Market research, volume |
| Conversational | 25-73% (avg 40-50%) | Medium | Real-time | All audiences, high engagement |
| Partner | 5-30% | Low-Med | Medium | New audiences, benchmarks |
How to Choose Survey Distribution Platforms
Match the method to your audience and survey type.
Quick decision guide:
Need immediate feedback after purchase? → SMS or in-app
Surveying B2B professionals? → Email (personalized, sent Tue-Thu 10 AM-2 PM)
Want post-event feedback? → QR codes + SMS follow-up
Testing website UX? → Embedded exit-intent surveys
Researching product ideas? → Panel + email to customers
Need high engagement? → Conversational (SmartReach)
Targeting 65+ age group? → Direct mail + phone
Quick brand poll? → Social media native polls
Distribution of Questionnaire Best Practices
These work across all survey distribution platforms and methods:
1. Don't Over-Survey
One survey per customer per month max. Companies that went from weekly to monthly surveys saw 40% higher response rates.
2. Mobile-Optimize
60% of responses come from mobile. Make surveys thumb-friendly with large buttons, one question per screen, minimal typing.
3. Perfect Your Invitation
Bad: "Please take our survey about your recent experience."
Good: "Hi Sarah! 2 questions about the blue sweater you ordered. Get $10 off next order. 90 seconds: [link]"
Personal. Specific. Incentive. Time commitment. Clear CTA.
4. Use Smart Incentives
$10 gift cards increase response 30-50%. "10% off next visit" works better than vague "help us improve."
5. Time It Right
Email: Tue-Thu, 10 AM-2 PM (B2B) or 7-9 PM (consumer) SMS: 10-11 AM or 6-7 PM
In-app: After positive actions, not errors
6. Segment Your Audience
Don't blast everyone with the same survey method.
- First-time buyers → Email product survey
- Repeat customers → SMS NPS
- Cart abandoners → Website pop-up
- Inactive users → Direct mail with incentive
7. Test Everything
A/B test subject lines, send times, incentives, question order. Companies that test systematically improve response rates 20-40% within 6 months.
Questionnaire Distribution Methods: Common Mistakes
Mistake 1: Using only one channel Different people prefer different methods. Use multi-channel: email first, SMS reminder to non-openers, in-app for engaged users.
Mistake 2: Generic messaging
"Dear valued customer" gets ignored. "Hi Sarah, question about your Tuesday order" works.
Mistake 3: Wrong survey length for channel SMS = 1-3 questions max. Email = up to 15. Phone = up to 10.
Mistake 4: Poor mobile experience Desktop-designed surveys fail on mobile. Use conversational format, large buttons, minimal scrolling.
Mistake 5: No follow-up Send reminder to non-responders after 48-72 hours. Different message, different angle.
Mistake 6: Ignoring legal compliance Get SMS opt-in (TCPA). Include email unsubscribe (CAN-SPAM). Disclose data use (GDPR/CCPA).
Mistake 7: Not testing first Test with 50-100 people before sending to 50,000. Fix broken links and confusing questions.
Survey Distribution Platforms
Most survey distribution platforms force you to choose between channels. SmartReach lets you use all of them with one tool.
Why SmartReach beats traditional survey distribution platforms:
Multi-channel deployment: Send the same conversational survey via email, SMS, web embed, WhatsApp, social—whatever works for your audience.
4x higher completion rates: Conversational format (one question at a time) feels natural. Traditional surveys feel like work.
Adaptive logic: Follow-up questions change based on responses. If someone rates you 3/10, you ask why. If they rate 9/10, you ask for a referral.
Real-time analytics: See responses as they come in. Sentiment analysis flags issues immediately.
Mobile-first: Optimized for thumbs. Large buttons, swipe navigation, no tiny text boxes.
Smart distribution: Send surveys at optimal times per person. Automatically resend via different channel if no response.
Real results:
- Healthcare company: 15% → 52% completion (email to conversational SMS)
- SaaS startup: 22% → 58% completion (traditional to conversational in-app)
- Retail chain: 8% → 45% completion (generic email to personalized SMS)
These results align with verified benchmarks showing 3-4x improvement with conversational format and multi-channel distribution.
14-day free trial • Cancel Anytime • No Credit Card Required • No Strings Attached
Deploy your first conversational survey in 10 minutes. See the difference yourself.
Key Takeaways
Your survey questions don't matter if nobody responds. Distribution method is everything.
What works in 2026:
- SMS for quick, mobile-first surveys (40-60% response, 98% open rate)
- Conversational for all survey types (25-73% completion, averaging 40-50%)
- Multi-channel approach (email + SMS reminder typically improves results 30-40%)
- Personalization (up to 48% response vs 10-15% generic)
- Mobile-first design (60% of responses are mobile)
- Strategic incentives ($5-10 gift card typically lifts response 25-40%)
What doesn't work:
- Generic email blasts (6-10% response)
- Long surveys via SMS (drastically reduces completion)
- Desktop-only design (loses 60% of potential respondents)
- Over-surveying (weekly surveys to same people tanks response)
- Vague "help us improve" messaging (specific incentives perform better)
The gap between 10% and 50% response rates comes down to choosing the right survey distribution method for your audience and executing it properly.
SmartReach combines the best survey distribution methods—conversational format, multi-channel deployment, mobile optimization—in one platform.
→ See 4x higher completion rates and try SurveySparrow
14-day free trial • Cancel Anytime • No Credit Card Required • No Strings Attached

")


