![Net Promoter Score Explained: A Simple Guide to Customer Loyalty [2026]](/_next/image/?url=https%3A%2F%2Fstatic.surveysparrow.com%2Fsite%2Fstrapi-content%2Fuploads%2F2025%2F12%2Flarge_17_46ec9c6b17.png&w=3840&q=100 "Net Promoter Score Explained: A Simple Guide to Customer Loyalty [2026]")


Customer loyalty doesn’t usually break in one big moment. For most businesses, especially small and mid-sized ones, it slips away quietly. A missed follow-up here. Slow support there. Small frustrations customers never bother to complain about.
That's why Net Promoter Score (NPS) helps. It brings those early signals to the surface. In a simple way, it shows how customers actually feel about your business, and whether they’re likely to recommend you or leave without saying a word.
At its core, NPS comes down to one straightforward question: How likely are you to recommend us to a friend or colleague? The answer tells you a lot. Who’s genuinely loyal. Who’s on the fence. And who’s already at risk.
In this guide, we’ll walk through what Net Promoter Score is, how it works, why it still matters in 2026, and how businesses use it to keep customers, reduce churn, and grow through genuine advocacy, without long surveys or guesswork.
NPS explained: The basics you need to know
Net Promoter Score (NPS) has emerged as the gold standard to measure customer loyalty since 2003. This system uses a straightforward metric that connects to business growth instead of complex question matrices. The system works because it captures customer sentiment in a powerful way.
Definition of Net Promoter Score (NPS)
NPS measures customer experience and shows how likely customers will recommend your business to others. Fred Reichheld worked with Bain & Company and Satmetrix to develop this metric. They introduced it in a groundbreaking Harvard Business Review article "The One Number You Need to Grow" in 2003.
The system calculates the difference between your promoters (enthusiastic customers) and detractors (unhappy customers). Scores range from -100 to +100, and higher numbers suggest stronger customer loyalty and satisfaction.
NPS relates closely to business success. Research from Bain & Company shows that companies with high NPS scores grow at more than twice the rate of their competitors. Companies that create sustained value and achieve long-term profitable growth typically have NPS scores twice as high as average companies.
The one-question survey that powers NPS
NPS shines through its simplicity. Everything centers on one question:
"On a scale of 0 to 10, how likely is it that you would recommend [Organization X/Product Y/Service Z] to a friend or colleague?"
Customer responses fall into three groups:
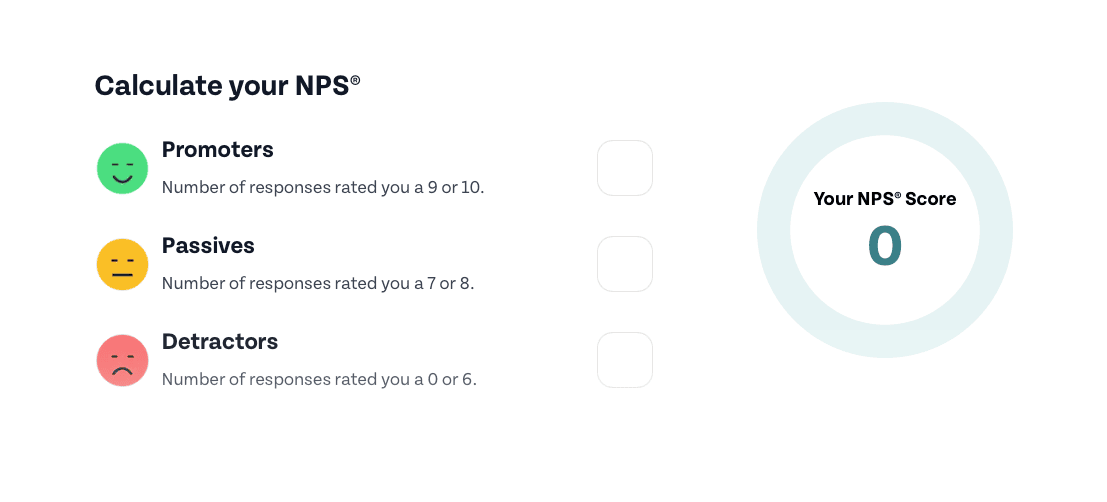
- Promoters (score 9-10): Loyal enthusiasts who continue buying and get more and thus encourage more business through referrals
- Passives (score 7-8): Satisfied customers who might switch to competitors
- Detractors (score 0-6): Unhappy customers who could harm your brand through negative word-of-mouth
You can calculate NPS easily: subtract the percentage of detractors from promoters. To cite an instance, see this example: with 60% promoters, 25% passives, and 15% detractors, your NPS would be 45 (60-15).
This question emerged from extensive research. Reichheld's team tested many loyalty questions and found that "Would you recommend?" best predicted a customer's likelihood to repurchase or renew.
SurveySparrow suggests adding an open-ended "Why?" after the NPS question. This qualitative feedback adds context to the score and provides useful insights to improve.
Why NPS is still relevant in 2026
NPS continues to thrive in businesses of all sizes in 2026, despite Gartner's 2021 prediction that "more than 75% of organizations would stop using the Net Promoter Score system by 2025". Several factors explain this staying power:
NPS delivers clear, useful data. Organizations can improve their services using both quantifiable metrics and qualitative insights from follow-up questions. The system has evolved into a vital part of a broader CX measurement framework that captures today's complex customer interactions.
Leaders value NPS because it relates directly to profits. The system quantifies customer loyalty, making it easier to show ROI on customer experience initiatives.
The system has adapted well to modern needs. AI-powered analytics have changed how teams utilize NPS data. Live signal capture through sentiment analysis and voice analytics helps uncover problems faster than traditional surveys.
SurveySparrow's conversational surveys offer a modern way to implement NPS effectively. These surveys boost response rates and generate better feedback. You can quickly turn raw NPS data into growth strategies using AI-powered sentiment analysis and automated insight tagging.
Start collecting meaningful feedback today with SurveySparrow's ready-to-use NPS survey template and see how NPS can enhance your customer insights.
Product NPS® Survey Template
Use This TemplateBreaking down the NPS score calculation

Image Source: Gramener Blog
The math behind Net Promoter Score is simple yet needs precision. The true value lies in what each customer group means and how they affect your business growth.
Who are promoters, passives, and detractors?
NPS helps segment your customers into three distinct categories based on their responses to the likelihood-to-recommend question:
Promoters (scores 9-10) are your most valuable customers. These loyal fans spread the word about you to friends and colleagues. They typically:
- Buy more and increase their spending over time
- Account for more than 80% of referrals in most businesses
- Generate positive word-of-mouth marketing
- Make employee interactions pleasant
Passives (scores 7-8) are satisfied but unenthusiastic customers. They don't criticize your brand actively, but they:
- Show repurchase and referral rates up to 50% lower than promoters
- Give qualified but lukewarm recommendations
- Switch to competitors when better offers appear
- Could become promoters with proper attention
Detractors (scores 0-6) point to issues that need quick fixes. These unhappy customers:
- Create over 80% of negative word-of-mouth
- Show high churn rates and defection
- Look profitable on paper but hurt your reputation through criticism
- Keep new customers away and lower team morale
How to calculate your net promoter score
The NPS calculation formula is simple: subtract the percentage of detractors from the percentage of promoters.
NPS = % of Promoters - % of Detractors
Here's a step-by-step guide:
- Survey your customers with the standard NPS question
- Categorize responses into promoters (9-10), passives (7-8), and detractors (0-6)
- Calculate the percentage of promoters and detractors from total responses
- Subtract the percentage of detractors from the percentage of promoters
Let's say you surveyed 100 customers and got 70 promoters, 10 passives, and 20 detractors:
- 70% promoters - 20% detractors = NPS of 50
Passives count in your total respondents but don't affect the NPS formula directly. They matter because they're the easiest to turn into promoters with targeted improvements.
Visualizing your NPS with real examples
Good visualization turns your NPS data into useful insights. Here are some effective approaches:
Pictograph bar charts show how individual ratings (0-10) are distributed and reveal patterns within categories. You'll see if most detractors scored 5-6 (easier to convert) versus 0-1 (deeply unhappy).
Stacked bar charts help compare NPS across products, services, or time periods. They clearly display each customer segment's size.
Line charts with trend lines show NPS changes over time and help measure how specific improvements affect scores.
NPS dashboard widgets blend multiple visualizations like gages, frequency distributions, and trend analyzes to give a full view of customer sentiment.
Use SurveySparrow to calculate your NPS
Manual NPS calculations take time, especially with big datasets. SurveySparrow's NPS calculator offers a better way.
SurveySparrow lets you:
- Create NPS surveys that get up to 40% higher response rates
- Calculate your NPS score automatically without spreadsheets
- See results through accessible dashboards
- Break down responses for deeper insights
- Set up automatic follow-ups to close the feedback loop
SurveySparrow's AI-powered text analysis finds common themes in your open-ended feedback. This reveals why you got certain scores and helps you focus on changes that will boost customer loyalty most effectively.
Try SurveySparrow's free NPS calculator to measure your customer satisfaction and find growth opportunities quickly.
How to interpret your NPS results
Your Net Promoter Score needs context to make sense. A number alone won't tell you much about your business or how to use it well.
What is a good NPS score in your industry?
A "good" NPS means different things in different sectors. Bain & Company says scores above 0 are good, above 20 look favorable, above 50 show excellence, and anything above 80 ranks as world-class. But these standards tell only part of the story.
Looking at industry averages helps paint a clearer picture. The Qualtrics XM Institute found grocery stores average an NPS of 30, video streaming services hit 29, while consumer payments lag at -6. Software companies typically score between 40-44.
Location matters too. European customers rate more conservatively and rarely give 9s or 10s. Americans tend to be more generous with high scores. Japanese ratings consistently run lower due to cultural differences, no matter how satisfied customers are.
Start by checking your industry benchmarks. Then work on beating your market competitors.
Related read: Guide to benchmark NPS scores
Tracking NPS over time vs. one-time snapshots
One NPS measurement doesn't tell you much. Contentsquare puts it well: "Just as a single snapshot of a tennis match can't help you predict the tournament's winner, a single NPS survey result won't give you the context and insight you need".
Regular tracking shows if customer sentiment goes up or down. Monthly or quarterly measurements work best, depending on your business cycle. This regular schedule lets you:
- See how specific initiatives affect customer loyalty
- Spot problems before they become systemic
- Check if your improvements make a difference
Yes, it is often better to measure against your own past performance than industry averages.
Using NPS to predict churn and loyalty
NPS helps predict business performance effectively. Research shows promoters spend 3.5 times more than detractors. This gap grows even wider in beauty and women's clothing, where the difference is more than 4:1.
Combining customer churn data with NPS scores helps spot at-risk accounts early. Detractors leave more often, while passive customers buy again and refer others 50% less than promoters do.
To put this into practice, break down your NPS responses by:
- Customer demographics
- Purchase behavior
- Product usage patterns
- Geographic region
This breakdown shows which customer groups feel most and least satisfied. You can then focus your improvements where they'll best help keep customers and grow your business.
Turning feedback into action: What to do with your NPS
Getting NPS feedback is just the start—the real value comes from turning that feedback into action. Your NPS program will become just another metric without a good system to handle customer responses.
Closing the loop with detractors
Quick responses to unhappy customers can cut down customer losses significantly. Research shows that following up with detractors reduces customer losses by half. The best companies reach out to every detractor within 24-48 hours after they leave negative feedback.
Here's what you should do when responding to detractors:
- Thank them for their honest feedback and show you understand their frustration
- Ask specific questions to learn more about their problems
- Tell them exactly what steps you'll take to fix their issues
- Give them your direct contact details if they need to reach you
Charles Schwab and Apple's retail division make it a priority to contact every customer who gives them a low rating. Their managers review the background information before making calls to solve problems effectively.
Strengthening teams with live insights
NPS feedback works best when it reaches the right teams quickly. Leading companies skip the middleman and share customer comments directly with frontline staff and product teams.
Progressive Insurance shows how this works. They record customer follow-up calls (with permission) and share these recordings with employees who helped those customers. Written summaries don't have the same effect as hearing real customer voices. These recordings often lead to better service without much extra training.
Team leaders need this feedback to make smart decisions. American Express found that their most valuable customers had more trouble getting replacement cards. Their NPS scores dropped 25 points below average during these events. This knowledge led them to improve their process, which helped solve more problems on the first call by over 20%.
Finding root causes through text analysis
Text analytics helps turn customer comments into practical insights by spotting patterns across thousands of responses. This method helps sort feedback into categories like "ease of use," "feature availability," or "customer service".
The analysis shows which areas affect your scores the most. You can prioritize improvements using this formula:
Priority = (Impact × Segment Value) ÷ Effort
This calculation helps you spot quick wins—changes that make a big difference but don't take much work.
Automate follow-ups with SurveySparrow
SurveySparrow's workflow automation takes care of follow-ups automatically and makes sure every customer gets attention. The platform lets you:
- Send personalized follow-up emails based on scores
- Create support tickets automatically for unhappy customers
- Send feedback to the right team members based on topics
- Keep track of solutions until they're complete
SurveySparrow helps you create workflows that send detractor feedback straight to specific team members who can fix issues quickly. This organized approach means no feedback gets missed—and helps turn unhappy customers into loyal fans.
SurveySparrow's automated NPS workflows can help you handle feedback better and turn customer insights into real improvements.
Beyond NPS: Combining metrics for a full picture
NPS gives good insights, but using it as the only metric limits your grasp of customer experience. One measurement cannot capture all the complexities of customer relationships. Smart organizations use multiple feedback tools to get a complete view that leads to better business choices.
When to use CSAT and CES alongside NPS
Your feedback system needs different metrics that each serve a specific purpose:
- NPS measures overall loyalty and relationship strength
- CSAT (Customer Satisfaction Score) captures immediate satisfaction with specific interactions or touchpoints
- CES (Customer Effort Score) shows how easily customers could achieve their goals
Studies reveal that 49% of NPS users measure other metrics too, and more than 33% specifically pair CSAT with NPS. These metrics work together—NPS shows overall sentiment, CSAT measures point-in-time satisfaction, and CES highlights friction.
Limitations of NPS as a standalone metric
NPS has its own drawbacks when used alone:
The metric turns complex customer experiences into a single number, which might miss important details. A customer scoring 0–6 falls into the detractor category despite possible major differences in their experiences.
You need larger sample sizes with NPS to get reliable results. About 1,000 participants are needed to estimate NPS within 10 percentage points, while 300–400 participants can give accurate promoter or detractor percentages.
NPS numbers don't explain customer feelings. The score alone offers limited actionable information without extra context.
How to build a complete customer experience strategy
A reliable CX strategy uses several complementary metrics along with operational data. Companies tracking NPS, CSAT, and CES together perform better in customer retention, loyalty, and revenue growth.
Map each metric to specific customer journey stages. NPS works best for relationship health, CSAT fits touchpoints like purchases or support calls, and CES measures process difficulty.
Combine sentiment metrics with operational data like interaction time, hold duration, or usage patterns. This approach reveals root causes—one bank found satisfaction dropped sharply when interactions exceeded five minutes.
These metrics create value only when combined with customer feedback and used to drive real improvements.
Conclusion
Net Promoter Score is a powerful tool that turns customer loyalty into practical business insights. A single question can reveal a lot—but NPS becomes truly valuable when you interpret and act on the results.
Your score needs context to make sense. Industry benchmarks and historical performance matter more than standalone numbers.
NPS works best when combined with CSAT and CES to capture every aspect of customer experience and uncover specific improvement opportunities.
NPS’s simplicity makes it effective. The straightforward question boosts response rates, while open-ended follow-ups add depth and meaning.
Want to reshape your customer experience strategy with NPS? SurveySparrow’s conversational surveys increase response rates, while AI analytics help spot patterns and prioritize fixes that turn unhappy customers into loyal fans.
Remember: collecting feedback without action is pointless. Close the loop, empower teams, and fix core issues to build lasting customer loyalty.


")

