Others
Executive Dashboards: Industry Insights & Decision Support
Article written by Thresa Roshni
Product Marketer at SurveySparrow
10 min read
19 September 2025

Do you know that data analysis has now become crucial for corporate decision-making?
However, dealing with raw data is time-consuming and labor-intensive. So how do you uncover those crucial business insights?
Yes, you got that right. Through Executive Dashboards!
Executive Dashboards serve as visual tools, converting complex data into graphical representations. These visual representations will help business executives make effective decisions with dashboard insights.
In this blog post, we will learn more about executive dashboards and how different industries use them for industry-specific dashboard solutions.
What is an Executive Dashboard?
An Executive Dashboard provides a visual representation of overall business performance by consolidating multiple survey insights in one place. This simplified data enables C-level executives and other decision-makers to focus on Key Performance Indicators (KPIs) that are vital for business growth.
Imagine an executive dashboard as the GPS for your survey data. Instead of handing you a thick manual, they offer a clear, colorful map.
This dashboard tool for executives includes charts, graphs, heat maps, and word clouds that make data more visually appealing and create a unified snapshot.
The purpose? To provide the executives with a bird’s eye view of their business progress and to make strategic dashboard solutions.
Turn a pile of survey responses into a straightforward journey with Executive Dashboards!
Planning to improve your customer experience? Read more on how to create a customer experience dashboard.

Use of Executive Dashboards in Different Industries:
Retail Industries:
With the thriving retail business, being on top of the market has become crucial for retailers. Thus, retail executives need to stay proactive and make smarter decisions for their business growth.
But how do they do it?
A study by Harvard Business School says that retailers who adopted analytics dashboards increased their revenue by an average of 13-20%.
Here’s how retailers make strategic decisions with various key metrics,
- Customer Satisfaction (CSAT) and Net Promoter Score (NPS): Assess customer satisfaction levels and measure the likelihood of customers recommending your store.
- Online and In-Store Sales Comparison: Compare sales performance between online and physical retail channels.
- Employee Performance: Evaluate the performance of sales associates and customer service staff to ensure a positive customer experience.

Ready to streamline your insights and make data-driven decisions?
A personalized walkthrough by our experts. No strings attached!
Healthcare Industries:
A patient’s journey starts well before they reach out to or enter the healthcare system. Ultimately, an ailing patient desires more than just satisfactory care.
Patients are not customers. However, healthcare industries that are patient-centric are likely to generate higher revenue than ones that fail to deliver patient care.
Asking patients or their caretakers about their experience and analyzing insights using dashboards will help you deliver better patient care.
Consider these key metrics in your healthcare dashboards,
- Patient Experience: Use radar charts and compare your patient experience across different healthcare categories.
- Clinical Performance Metrics: Identify patient satisfaction with healthcare performance such as communication, cleanliness, and overall experience.
- Staff Courtesy and Professionalism: Assess patient satisfaction with the professionalism and courtesy of hospital staff.
Automobile Industries:
One of the fastest-growing industries in the world is the automobile industry. To sustain the rapidly changing market trends, it has now become important for automobile executives to analyze and work on customer feedback.
Prioritizing customer feedback to ensure they feel genuinely appreciated for your service is one way to stay on top of the market.
This can be achieved by analyzing metrics such as,
- Customer Journey Analysis: Enhance customer touchpoints using customer journey charts to identify areas of improvement.
- Service Satisfaction: Gain a comprehensive overview of customer satisfaction with your post-purchase services.
- Customer Loyalty: Identify how likely customers recommend your brand to their friends and families using NPS gauge charts.
Banking, Financial Services and Insurance (BFSI):
Highly competitive sectors such as banking and insurance should majorly focus on customer retention rather than customer acquisition.
Customer satisfaction in banks does not depend merely on the transactions and services but also their personalized interactions.
Thus, it is important to boost retention rates in the banking sector by focusing on metrics such as,
- Digital Experience: Provide a better digital experience for your customers by assessing ratings and reviews of your banking website and mobile application.
- Customer Effort Score (CES): Analyze and improve the ease of completing transactions, transferring funds, and managing accounts online.
- Support Satisfaction: Measure and evaluate the satisfaction levels of customer support interactions and the promptness in resolving customer complaints.
Hospitality:
With people getting more excited about travel, tourism, and trying new foods, the hospitality industry is growing rapidly.
The diverse segments in the hospitality industry such as travel, accommodation, food and beverage, create a need for the executives to have all data analyzed in one place.
The following metrics with easy-to-understand charts and graphs help in analyzing data across sectors,
- Check-in efficiency: Use line charts to display the percentage of check-ins completed within set time intervals.
- Customer journey charts: Map your customer journey and prioritize the areas of improvement by analyzing trends and customer behaviors.
- Customer Satisfaction (CSAT) and Net Promoter Score (NPS): Measure overall customer satisfaction and assess customer loyalty using CSAT and NPS.
It is important to create dashboards that match the unique needs of different executives. Read more on our types of dashboards to create displays that align with your requirements.
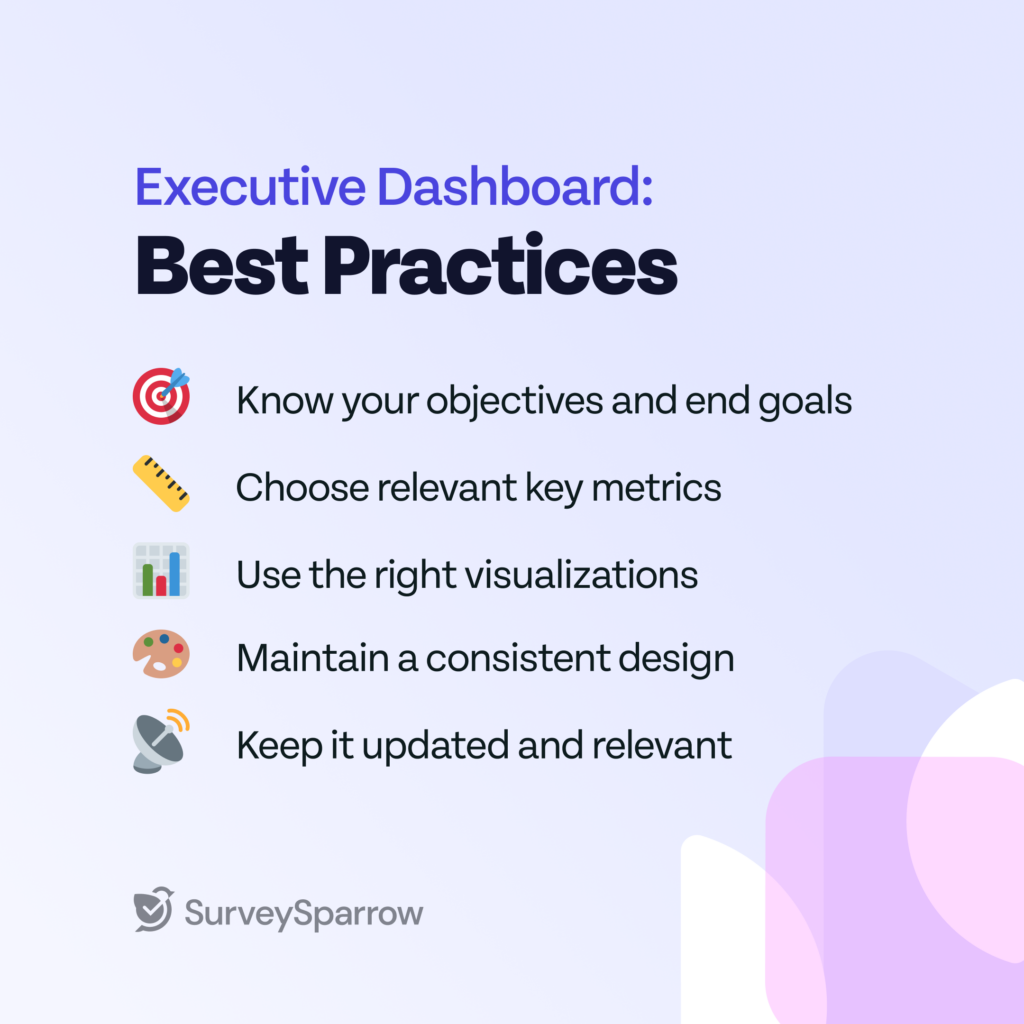
Executive Dashboards Best Practices:

1. Know your objectives and end goals:
There’s no one-size-fits-all dashboard especially when it comes to different industries.
For example, a retail executive might prioritize tracking sales performance across stores, while a hospitality executive might focus on guest satisfaction levels.
Thus, tailoring your dashboards with your end goals in mind is crucial to getting the right business insights.
2. Choose relevant key metrics:
Once you decide on what targets to focus on, choosing the right metrics becomes a walk in the park.
For example, using metrics such as Net Promoter Score (NPS) and customer churn rate offers valuable insights into customer satisfaction and brand loyalty.
3. Use the right visualizations
Choose the right charts, graphs and visuals to effectively represent your data.
For example, using radar charts to asses various KPIs instead of stacked charts will ensure better visibility of key metrics.
4. Maintain a consistent design:
A consistent design throughout the dashboard will help you get better clarity and understanding of the data.
It also enhances your user experience and aligns with the overall brand image and value.
5. Keep it updated and relevant:
Maintain relevancy by focusing on performance-related data while ensuring regular updates to existing metrics.
Incorporating new metrics and updating business performance regularly offers real-time insights and enhances employee productivity.
Make effective dashboards with SurveySparrow:
SurveySparrow’s dashboard lets you go beyond the fundamentals and create a more accurate survey analysis.
Here’s how,
- Customizable widgets: Make your dashboard more insightful using the right widgets such as area charts, heat maps, bubble charts, word clouds and so on.
- Custom Metrics: Drill deeper into your survey insights and craft formulas that are more specific for your business.
- Targeted Sentiments: Gain a better understanding of your audience’s emotions to steer your strategy in the right direction.

Ready to streamline your insights and make data-driven decisions?
A personalized walkthrough by our experts. No strings attached!
Let’s summarize!
- Executive Dashboards help executives and decision-makers analyze data at a glance by simplifying complex information to simple visuals.
- Dashboards provide a snapshot of your overall business performance and help you make strategic decisions and analyze market trends.
- Various industries such as retail, healthcare, automobile, BFSI and hospitality make use of dashboards to leverage their operational efficiency and to achieve better outcomes.
14-day free trial • Cancel Anytime • No Credit Card Required • No Strings Attached
So, what are you waiting for?
Create your executive dashboard and boost your business with SurveySparrow!
Frequently Asked Questions:
1) What is an Executive Dashboard?
An Executive Dashboard is a visual tool that consolidates insights from multiple surveys in one place, providing a snapshot of business KPIs. This enables C-suite executives to have a bird’s eye view of overall business performance and helps them in making data-driven decisions.
2) What is the main purpose of the Executive Dashboard?
The main purpose of the executive dashboard is to offer C-level executives a consolidated and visual overview of key business metrics. The key metrics provided will empower executives to quickly identify trends and make informed decisions based on the key insights.
3) What are the benefits of using Executive Dashboards?
Important benefits of using Executive Dashboards include,
- Simplified data analysis.
- Centralized survey insights in one place.
- Efficient tracking of business progress.
- Improved decision-making.
4) Can we customize executive dashboards?
Yes, Executive Dashboards can be customized using visuals such as bubble charts, heat maps and word clouds that help you track business performance. Additionally, the custom metrics in executive dashboards will create a personalized dashboard and help in narrowing down your KPIs.
5) How to create an effective dashboard?
- Define the purpose and goals of your executive dashboard.
- Choose relevant key metrics from surveys for your business analysis.
- Use appropriate graphs, charts, and visuals to represent your KPIs.
- Update your dashboard metrics based on the changing organizational needs.

Thousands of brands trust SurveySparrow to turn feedback into growth. Try it free today!
Thresa Roshni
Creative wordsmith turning features into compelling narratives.
Related Articles

Others
Facebook Ad Size and Specification: The Complete Guide for 2020
14 MINUTES
18 June 2020

Others
The Future of AI in Marketing Automation: Key Trends and Strategies
9 MINUTES
4 July 2023

Others
Top 10 Competitor Analysis Tools for Different Use Cases
16 MINUTES
23 May 2024

Others
The Power of AI in Marketing: Applications, Pros, and Future Trends
8 MINUTES
18 July 2023
