

Most customer journey mapping tools do one thing well: they help you draw the map.
They give you a canvas, some sticky note templates, and a way to visualize the stages a customer goes through from awareness to loyalty. They look great in a strategy presentation. They're easy to share with stakeholders.
What they don't do is tell you what's actually happening at each stage of that journey.
That gap between the map and the measurement is where most CX programs fall short. Organizations spend weeks building a journey map and then realize they have no reliable way to know whether the experience they've designed is the experience customers are actually having.
The best customer journey mapping tools in 2026 are closing that gap. The tools worth investing in don't just help you visualize the journey — they help you measure it, track how sentiment shifts across touchpoints, and turn feedback into action plans with real ownership.
This guide compares the top 10 customer journey mapping tools across four dimensions: what they're built for, what they do best, where they fall short, and who they're right for.
What to Look for in a Customer Journey Mapping Tool
Before comparing tools, it helps to be clear on what you actually need. The market splits roughly into two categories:
Visualization-first tools — built for designing and communicating journey maps. Strong on templates, drag-and-drop interfaces, and collaboration features. Weak on live data and measurement.
Measurement-first tools — built for connecting journey stages to real feedback data. Strong on survey integration, sentiment tracking, and analytics. The map is a framework for organizing insights, not just a diagram.
Most organizations need both which is a way to design the journey and a way to measure it. The tools below are evaluated on both dimensions.
Key criteria to evaluate:
- Can you attach live feedback (surveys, NPS, CSAT) to individual touchpoints?
- Does the tool show how sentiment changes across journey stages?
- Can multiple teams collaborate and act on the data within the same tool?
- Does it support AI-assisted map building?
- What does it cost, and is there a free tier?
The 10 Best Customer Journey Mapping Tools in 2026
1. SurveySparrow
Best suited for: CX teams that want to connect journey maps to live survey feedback
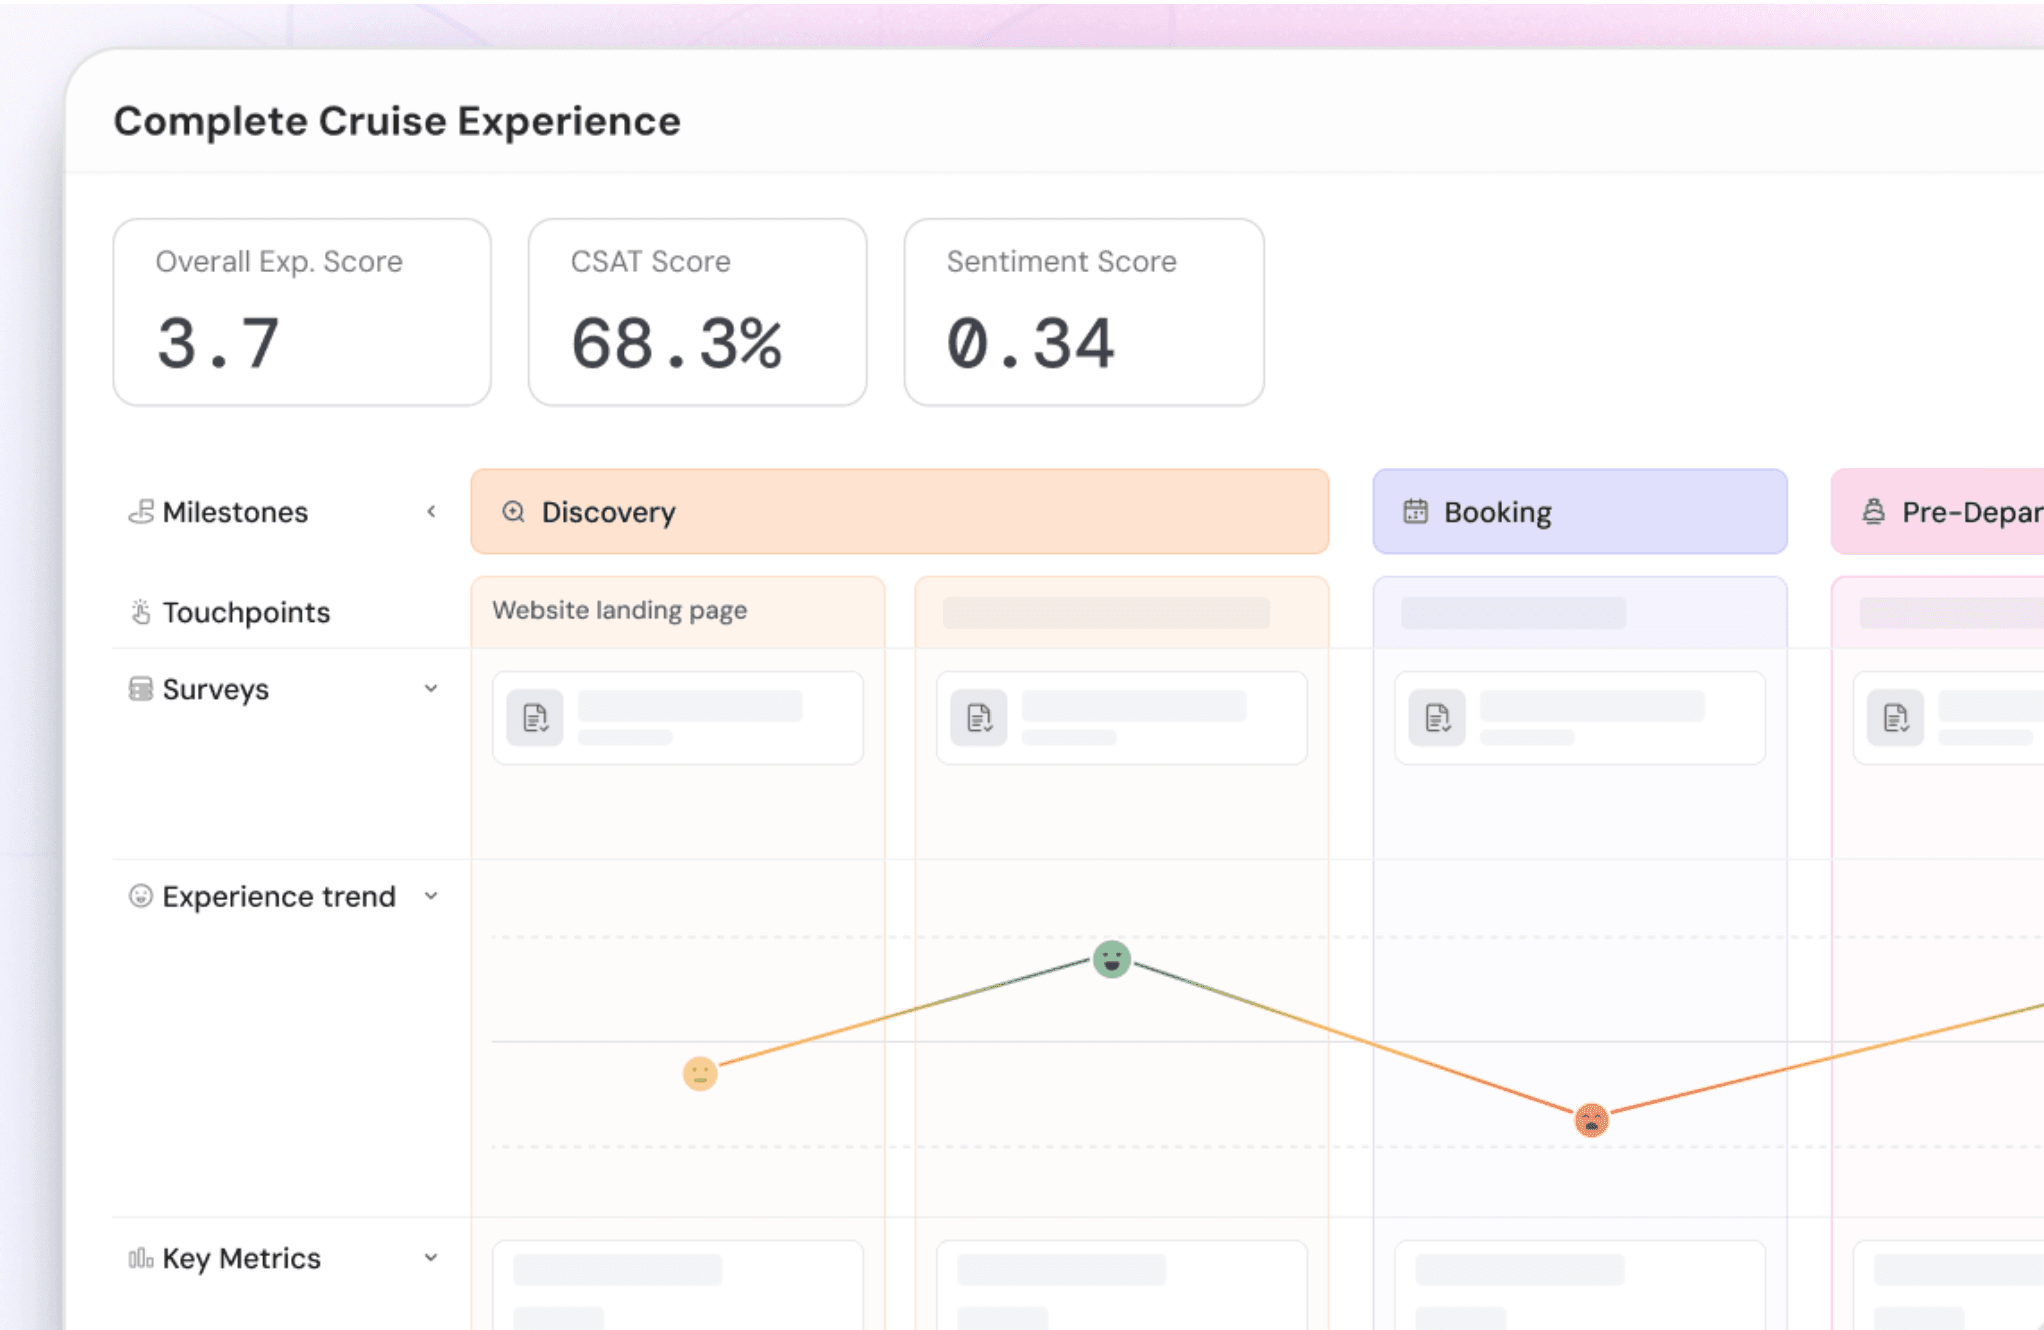
SurveySparrow's feature Journeys is purpose-built for the gap most mapping tools leave open — connecting every stage of the customer journey to real feedback data. Rather than building a static map, Journeys lets you structure your customer lifecycle into milestones and touchpoints, attach surveys to each touchpoint, and see how satisfaction scores and sentiment shift across the entire journey in one unified view.
Instead of analyzing feedback in isolated moments, Journeys tracks customer feedback sentiment across every stage of interaction — from the first moment of awareness to loyalty — all in one place.
What makes it different: Most journey mapping tools are visualization tools that you import data into. SurveySparrow Journeys is a measurement tool that organizes feedback into a journey structure. The map is built from the data — not the other way around.
Three ways to build a journey:
- Templates — browse an industry-specific template library (automotive, SaaS, retail, healthcare, hospitality) and customize it to your use case. The fastest way to get started if your lifecycle follows a standard structure.
- Start from scratch — build your own milestones and touchpoints from the ground up. Rename each stage to reflect your specific journey. Add the "+" icon to insert new milestones or new touchpoints within any milestone at any point.
- Create with AI — provide a plain-language prompt describing your customer lifecycle and the touchpoints you want to measure. The AI automatically generates milestones and touchpoints based on your input. Review, refine, and launch. This is the fastest path from zero to a live, feedback-connected journey.
Key features:
1. Journey structure:
- Milestones represent major lifecycle stages (Awareness, Onboarding, Support, Renewal — fully customizable per industry)
- Touchpoints are specific interactions within each milestone — each one can have its own dedicated survey
- Add, rename, and reorder milestones and touchpoints at any time without rebuilding the journey
2. Survey integration:
- Assign any survey (NPS, CSAT, CES, or custom) to each individual touchpoint
- Different touchpoints within the same milestone can use different surveys — e.g., a CES survey at the website discovery touchpoint and a CSAT survey at the demo booking touchpoint within the same Awareness milestone
- Survey responses flow directly into the journey view — no manual imports or exports
3. Analytics and insight:
- Visual trend chart shows how satisfaction scores move across milestones — immediately surfacing where the experience peaks and where it breaks down
- Sentiment analysis on open-ended responses automatically categorized as Positive (green), Neutral (yellow), or Negative (red) with key topics extracted per touchpoint
- KPI charts — create and track specific metrics against defined targets directly within the journey
- Lanes — add custom rows within any milestone for text annotations, topic breakdowns, action plans, reference links, or charts imported from the Executive Dashboard
4. Action and collaboration:
- Action plans built directly into each touchpoint with ownership, defined deadlines, and measurable target metrics — turning CX insights into trackable improvements
- Smart filters by respondent attributes, device, language, and date range for segment-level journey views
- Team sharing with granular permissions: view, edit, or share per journey
Real time example: A car brand uses SurveySparrow Journeys to track four milestones: Pre-purchase experience, Showroom experience, Post-purchase experience, and Customer referral. Under each milestone, specific touchpoints are measured with targeted surveys — a CES survey at the "pre-purchase research" touchpoint, a CSAT survey after the test drive, an NPS at vehicle delivery, and a referral likelihood survey at the final milestone. The trend chart immediately shows where satisfaction drops — revealing, for instance, that delivery handover scores 3.4/5 while the showroom experience scores 4.6/5 — pinpointing exactly where the experience breaks down without requiring any manual analysis.
Best for: Customer success teams, CX operations, product teams measuring satisfaction at specific feature touchpoints, automotive and retail brands with complex purchase journeys, and any organization that wants to move from static journey maps to live journey measurement.
Pricing: Part of SurveySparrow's CX platform. Free trial available. Book a demo →
2. UXPressia
Best for: UX and CX teams that need rich, visually detailed journey maps
UXPressia is one of the most established dedicated journey mapping tools. It offers a highly visual canvas with built-in persona creation, impact mapping, and detailed touchpoint documentation. Strong collaboration features make it well-suited for cross-functional teams that need to align on the customer experience.
Key features
- Journey map templates for multiple industries
- Persona builder integrated with maps
- Impact mapping for identifying high-priority touchpoints
- Real-time collaboration for distributed teams
- CSV import for bringing in external data
Limitation: UXPressia is primarily a visualization and documentation tool. It doesn't natively connect to survey data or track live satisfaction scores at touchpoints — you need to import data manually or use integrations.
Best for: UX researchers, product designers, and CX consultants who need to build and communicate journey maps with stakeholders.
Pricing: Free plan available (1 project). Paid plans from $16/user/month.
3. Smaply
Best for: Service design professionals and agencies
Smaply is a professional-grade journey mapping and service design tool. It supports multiple map types — customer journey maps, stakeholder maps, and system maps — making it particularly useful for service design projects that require understanding the full ecosystem around a customer experience, not just the customer's path.
Key features
- Multiple map formats: journey maps, stakeholder maps, system maps
- Storyboard visualization with image support
- Export to PDF, Excel, and PNG for reporting
- Collaboration and commenting within maps
- Integration with Jira for linking insights to development work
Limitation: Like UXPressia, Smaply is a documentation and visualization tool. Feedback data needs to be manually integrated. No native survey or sentiment tracking.
Best for: Service designers, consultants, and agencies building deliverable journey maps for client presentations.
Pricing: Free plan available. Paid plans from $25/user/month.
4. Miro
Best for: Teams that need a flexible visual workspace for collaborative mapping
Miro is a general-purpose collaborative whiteboard that happens to be widely used for journey mapping. It's not a dedicated journey mapping tool, but its flexibility, rich template library, and deep integration ecosystem make it a practical choice for teams that already use it for other purposes.
Key features
- Journey map templates (including pre-built CX templates)
- Infinite canvas for large, complex journey designs
- Real-time collaboration with 100+ users simultaneously
- Integration with Jira, Confluence, Slack, and 100+ other tools
- Sticky notes, voting, and facilitation tools for workshop use
Limitation: Miro is a blank canvas — it has no CX-specific data features, no survey integration, and no way to track satisfaction scores or sentiment. It's a documentation tool, not a measurement tool.
Best for: Distributed teams running journey mapping workshops, or organizations that want a flexible canvas they can adapt to their own process.
Pricing: Free plan (3 boards). Paid plans from $10/user/month.
5. Lucidchart
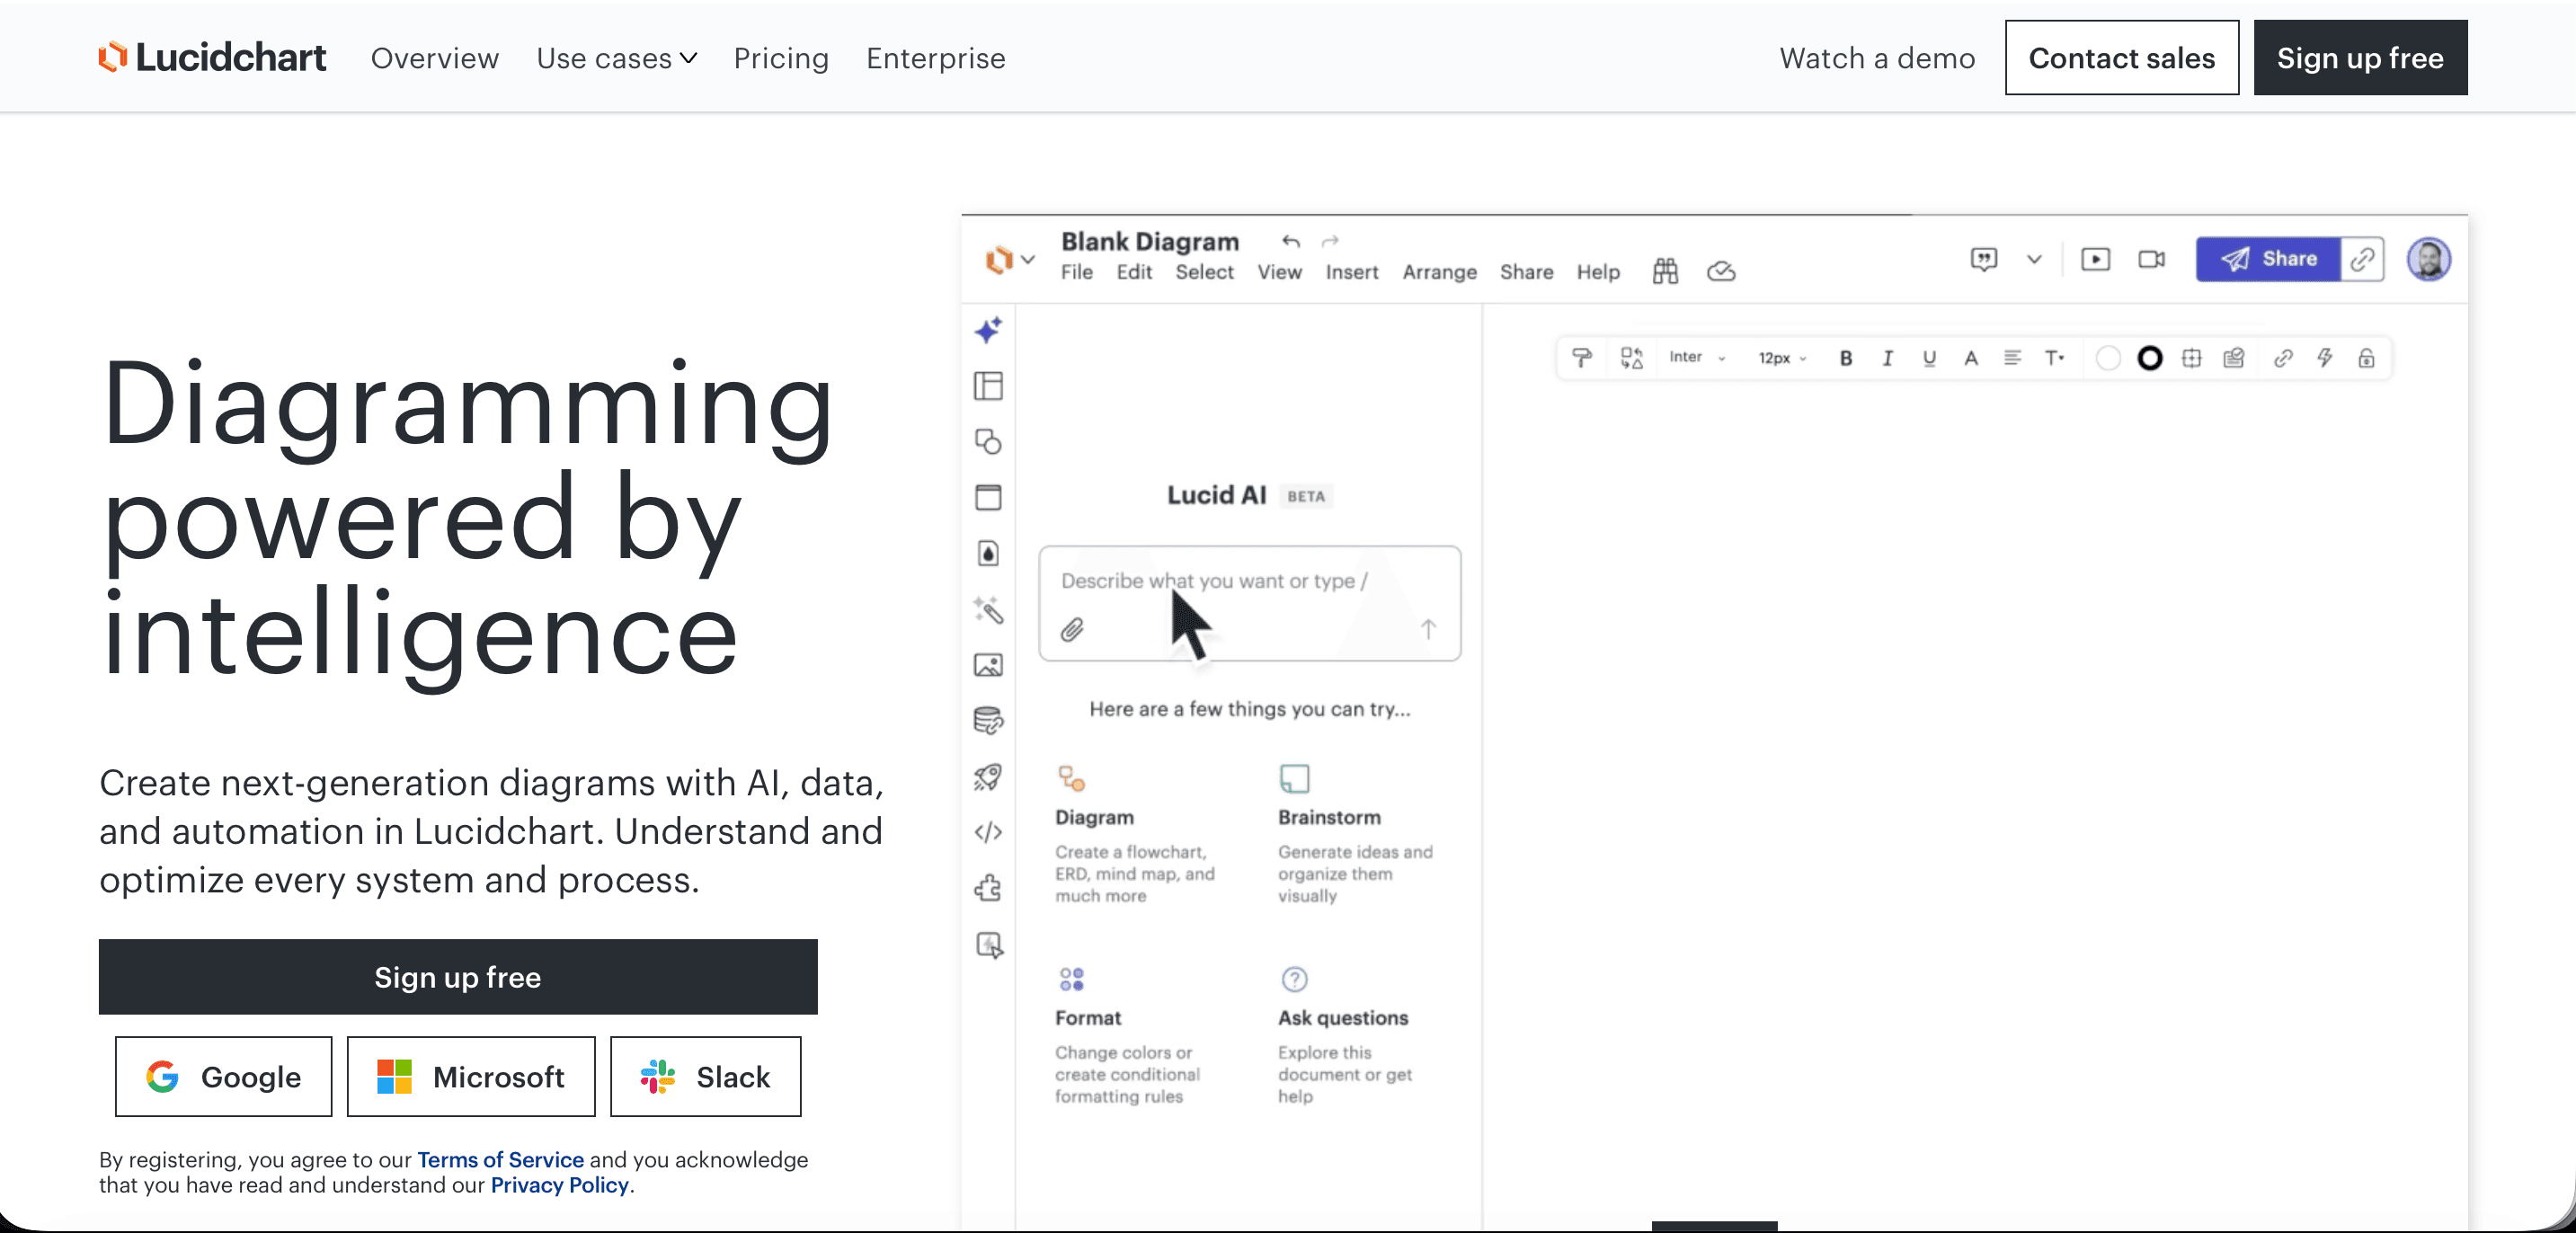
Best for: Organizations that want journey mapping within a broader diagramming suite
Lucidchart is a diagramming and visualization platform with strong journey mapping templates. Like Miro, it's a general-purpose tool used across many visualization tasks — process mapping, org charts, flowcharts — that includes journey mapping templates as part of its library.
Key features
- Journey map and experience map templates
- Integration with Google Workspace, Microsoft 365, Atlassian, and Salesforce
- Collaborative editing with commenting and version history
- Data linking to import external data into diagrams
- Export to multiple formats
Limitation: Purely a visualization tool. No native CX measurement features.
Best for: Operations and business analysis teams that use Lucidchart for diagramming broadly and want to keep journey mapping in the same ecosystem.
Pricing: Free plan available. Paid from $9/user/month.
6. Qualtrics XM
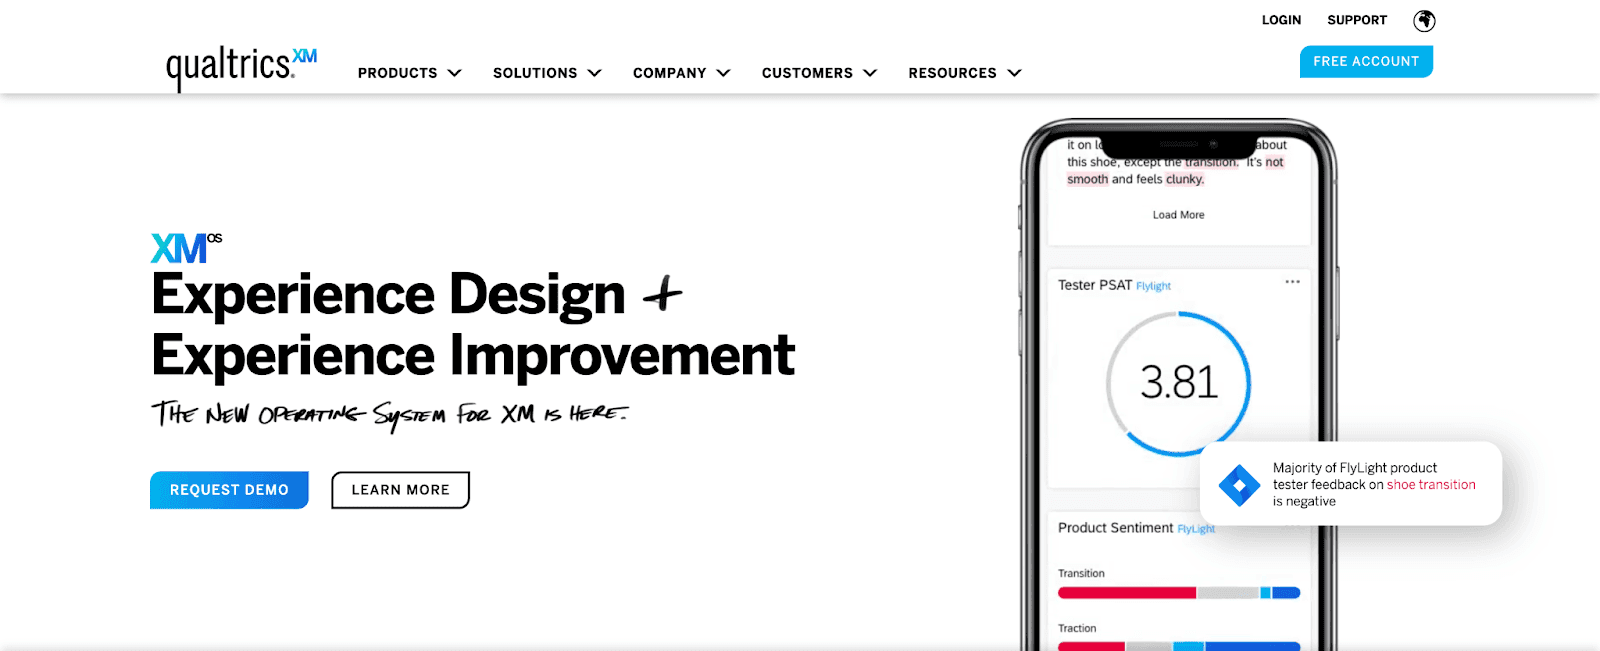
Best for: Enterprise organizations with complex, multi-channel CX programs
Qualtrics XM is an enterprise-grade experience management platform with journey orchestration capabilities. It's one of the few tools at this scale that genuinely connects survey data to journey stages — making it a measurement-first tool rather than a visualization-first tool.
Qualtrics Key features
- Journey orchestration across channels (email, SMS, app, web)
- Automated survey triggers based on customer behavior and journey stage
- Advanced analytics including text analytics and sentiment analysis
- Role-based dashboards for different stakeholders
- Integration with CRM and data warehouse tools
Limitation: Significant complexity and cost. Qualtrics XM is built for enterprise implementations with dedicated CX teams and IT resources. It's overkill for mid-size organizations and has a steep learning curve.
Best for: Enterprise organizations with dedicated CX operations teams, large survey volumes, and complex multi-channel journeys.
Pricing: Quote-based. Typically $15,000–$100,000+ per year depending on scale.
7. Medallia

Best for: Large enterprises focused on signal capture across physical and digital touchpoints
Medallia is an enterprise experience management platform similar in scope to Qualtrics. Its strength is breadth of signal capture — connecting feedback from digital interactions, contact center conversations, point-of-sale interactions, and operational data into a unified customer experience view.
Key features
- Omnichannel signal capture (surveys, reviews, social, call transcripts)
- Journey analytics connecting feedback to business outcomes
- Role-based action alerts for frontline teams
- AI-powered text analytics
- Deep integration with operational systems (CRM, POS, ticketing)
Limitation: Extremely expensive and resource-intensive to implement. Not suitable for organizations without significant CX budget and internal technical resources.
Best for: Retail, hospitality, financial services, and telecom enterprises with high transaction volumes and complex customer journeys.
Pricing: Quote-based. Enterprise pricing typically starts at $40,000+/year.
8. Contentsquare (including Hotjar)
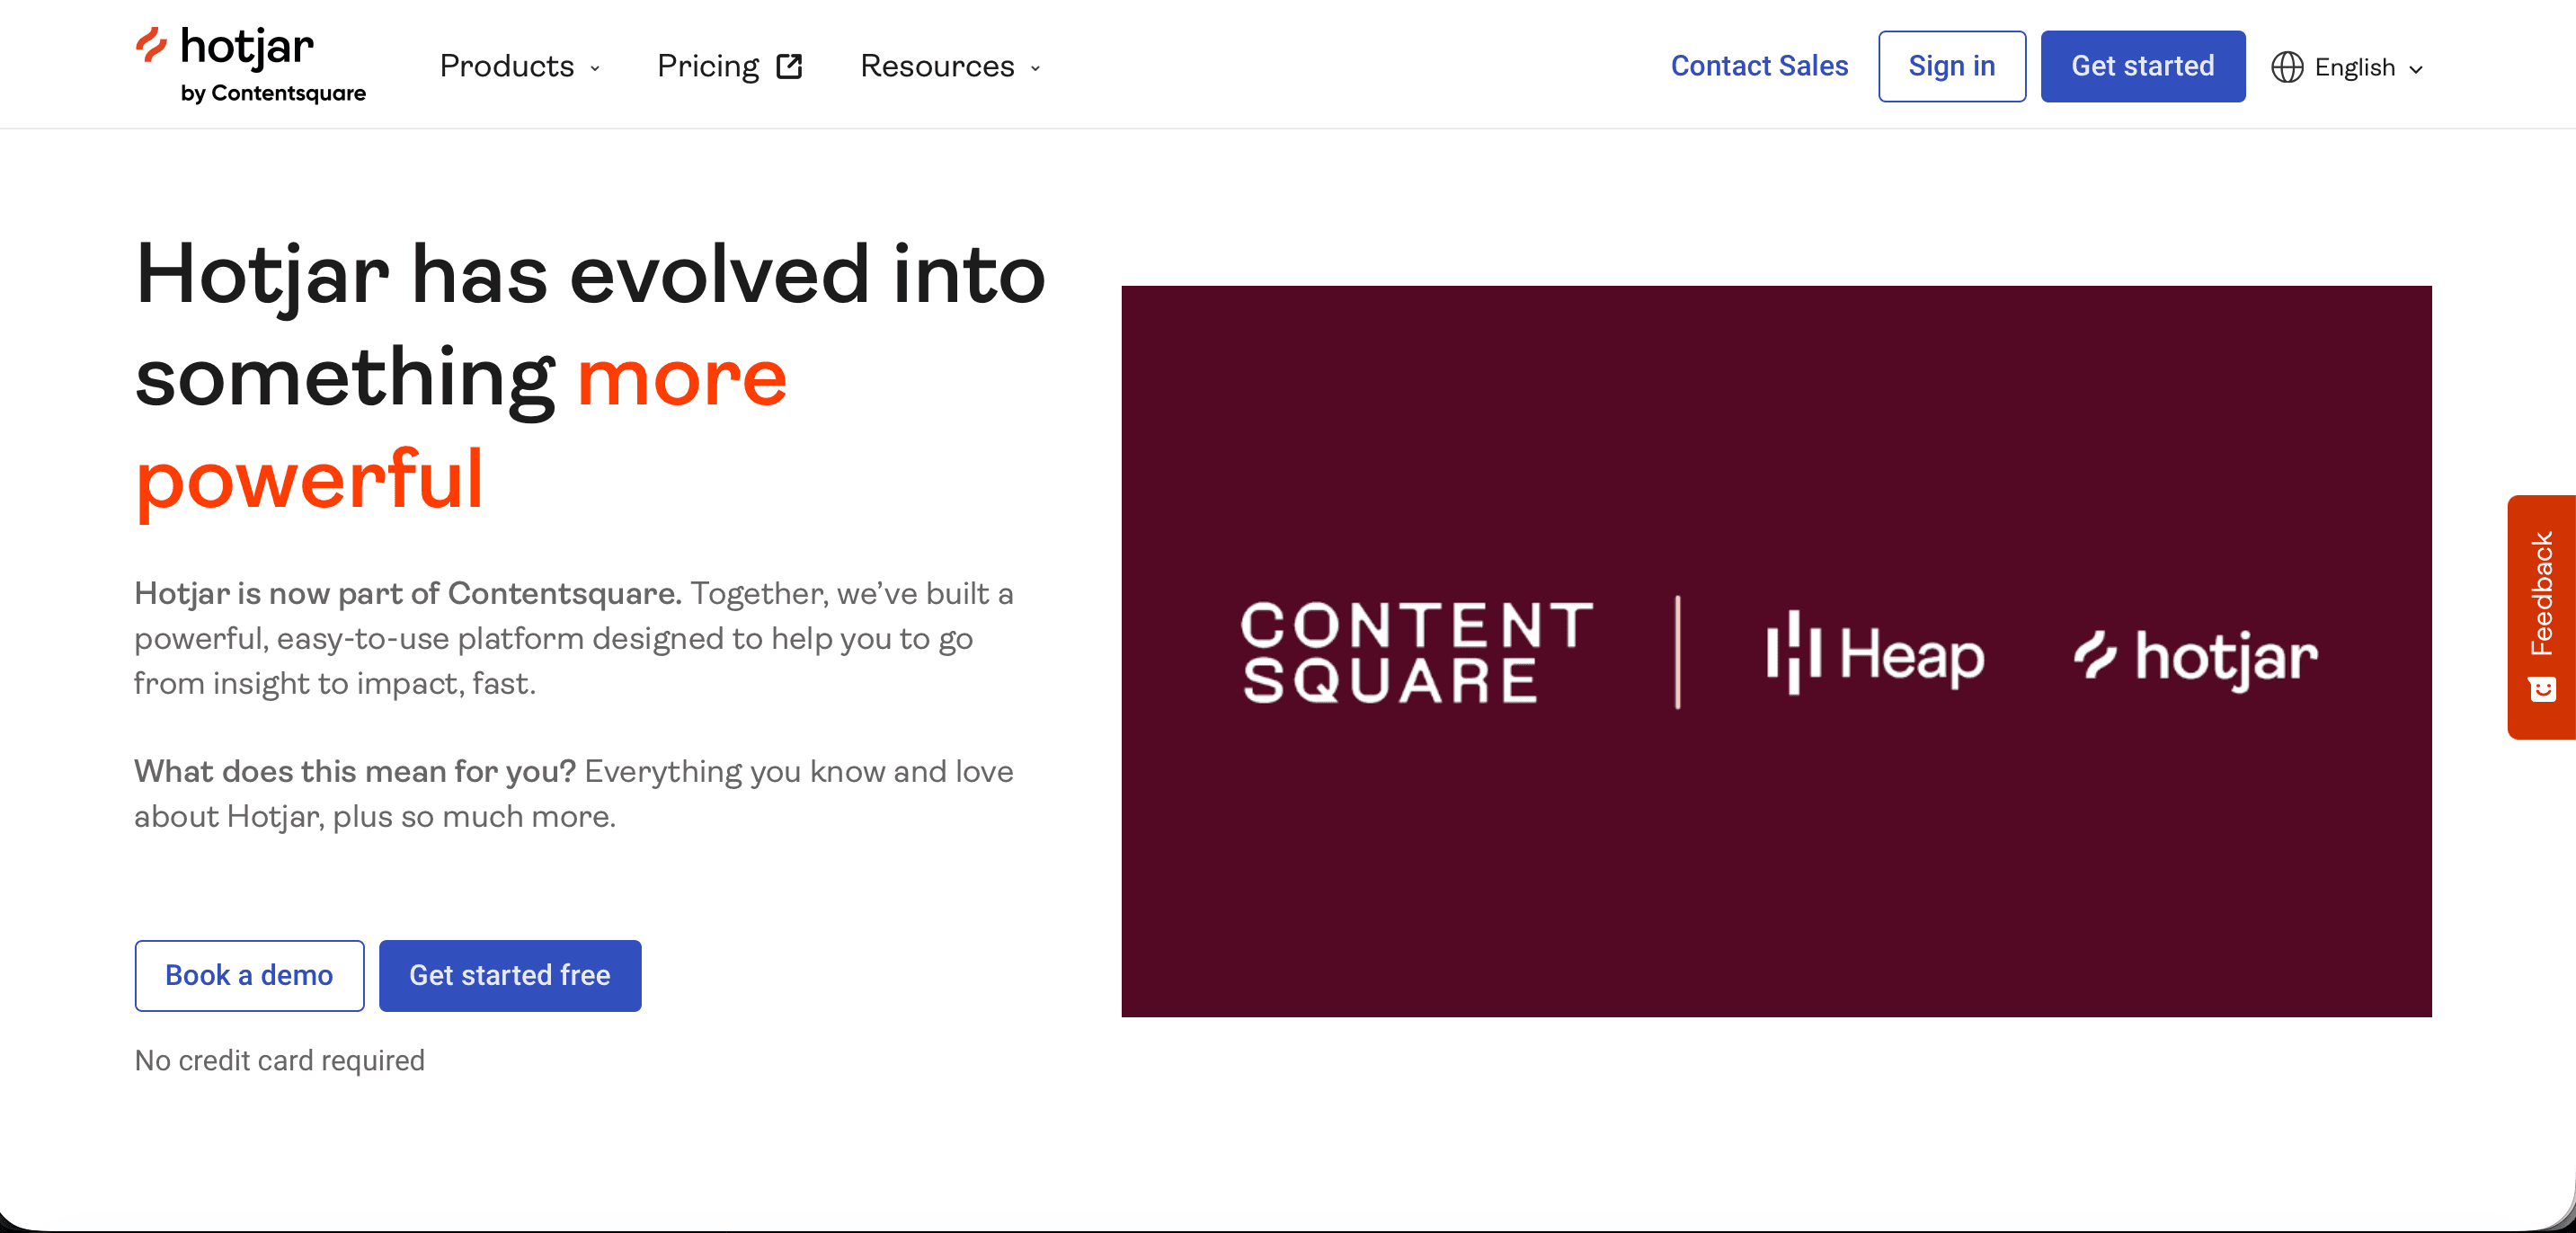
Best for: Digital teams at any scale — from startups to enterprise e-commerce
A note on this entry: Hotjar was acquired by Contentsquare in September 2021 and fully merged into the Contentsquare Group as of July 1, 2025. The two products still operate under separate brand names and interfaces, but they are now a single company building toward one unified platform — also incorporating Heap (acquired December 2023). If you're evaluating either Hotjar or Contentsquare today, you're evaluating different tiers of the same product family.
Hotjar (SMB and mid-market tier) sits at the intersection of user research and journey mapping for digital products. It captures behavioral data — session recordings, heatmaps, click maps — and connects it to on-site survey feedback, giving product teams a view of both what users do and what they think at specific moments in the digital journey.
Contentsquare (enterprise tier) goes significantly deeper on behavioral analytics — zone-based heatmaps with revenue attribution, AI-powered anomaly detection, and session replay with frustration signal detection — making it well-suited for large e-commerce and digital service businesses where small UX improvements have major revenue impact.
Key features
- Heatmaps, session recordings, and click maps (Hotjar / Contentsquare)
- On-site surveys (NPS, CSAT, open-ended) triggered at specific pages or events (Hotjar)
- Feedback widgets for continuous passive feedback collection (Hotjar)
- Zone-based heatmaps showing revenue impact per content area (Contentsquare)
- AI-powered alerts for anomalous behavior patterns (Contentsquare)
- Product analytics via Heap (behavioral event capture, funnel analysis, retention)
- Journey path analysis showing where users drop off across the digital experience
Limitation: Both tools are built exclusively for digital journeys — web and app only. Neither covers offline touchpoints, support interactions, or the broader customer lifecycle outside the digital product. Not a substitute for a full CX journey mapping platform.
Best for:
Hotjar tier: Product managers, UX researchers, and growth teams at SMBs optimizing the digital product experience
Contentsquare tier: E-commerce, financial services, and media enterprises with large traffic volumes where conversion rate improvements are high-value
Pricing: Hotjar — free plan available, paid from $32/month. Contentsquare — quote-based enterprise pricing.
9. Mixpanel
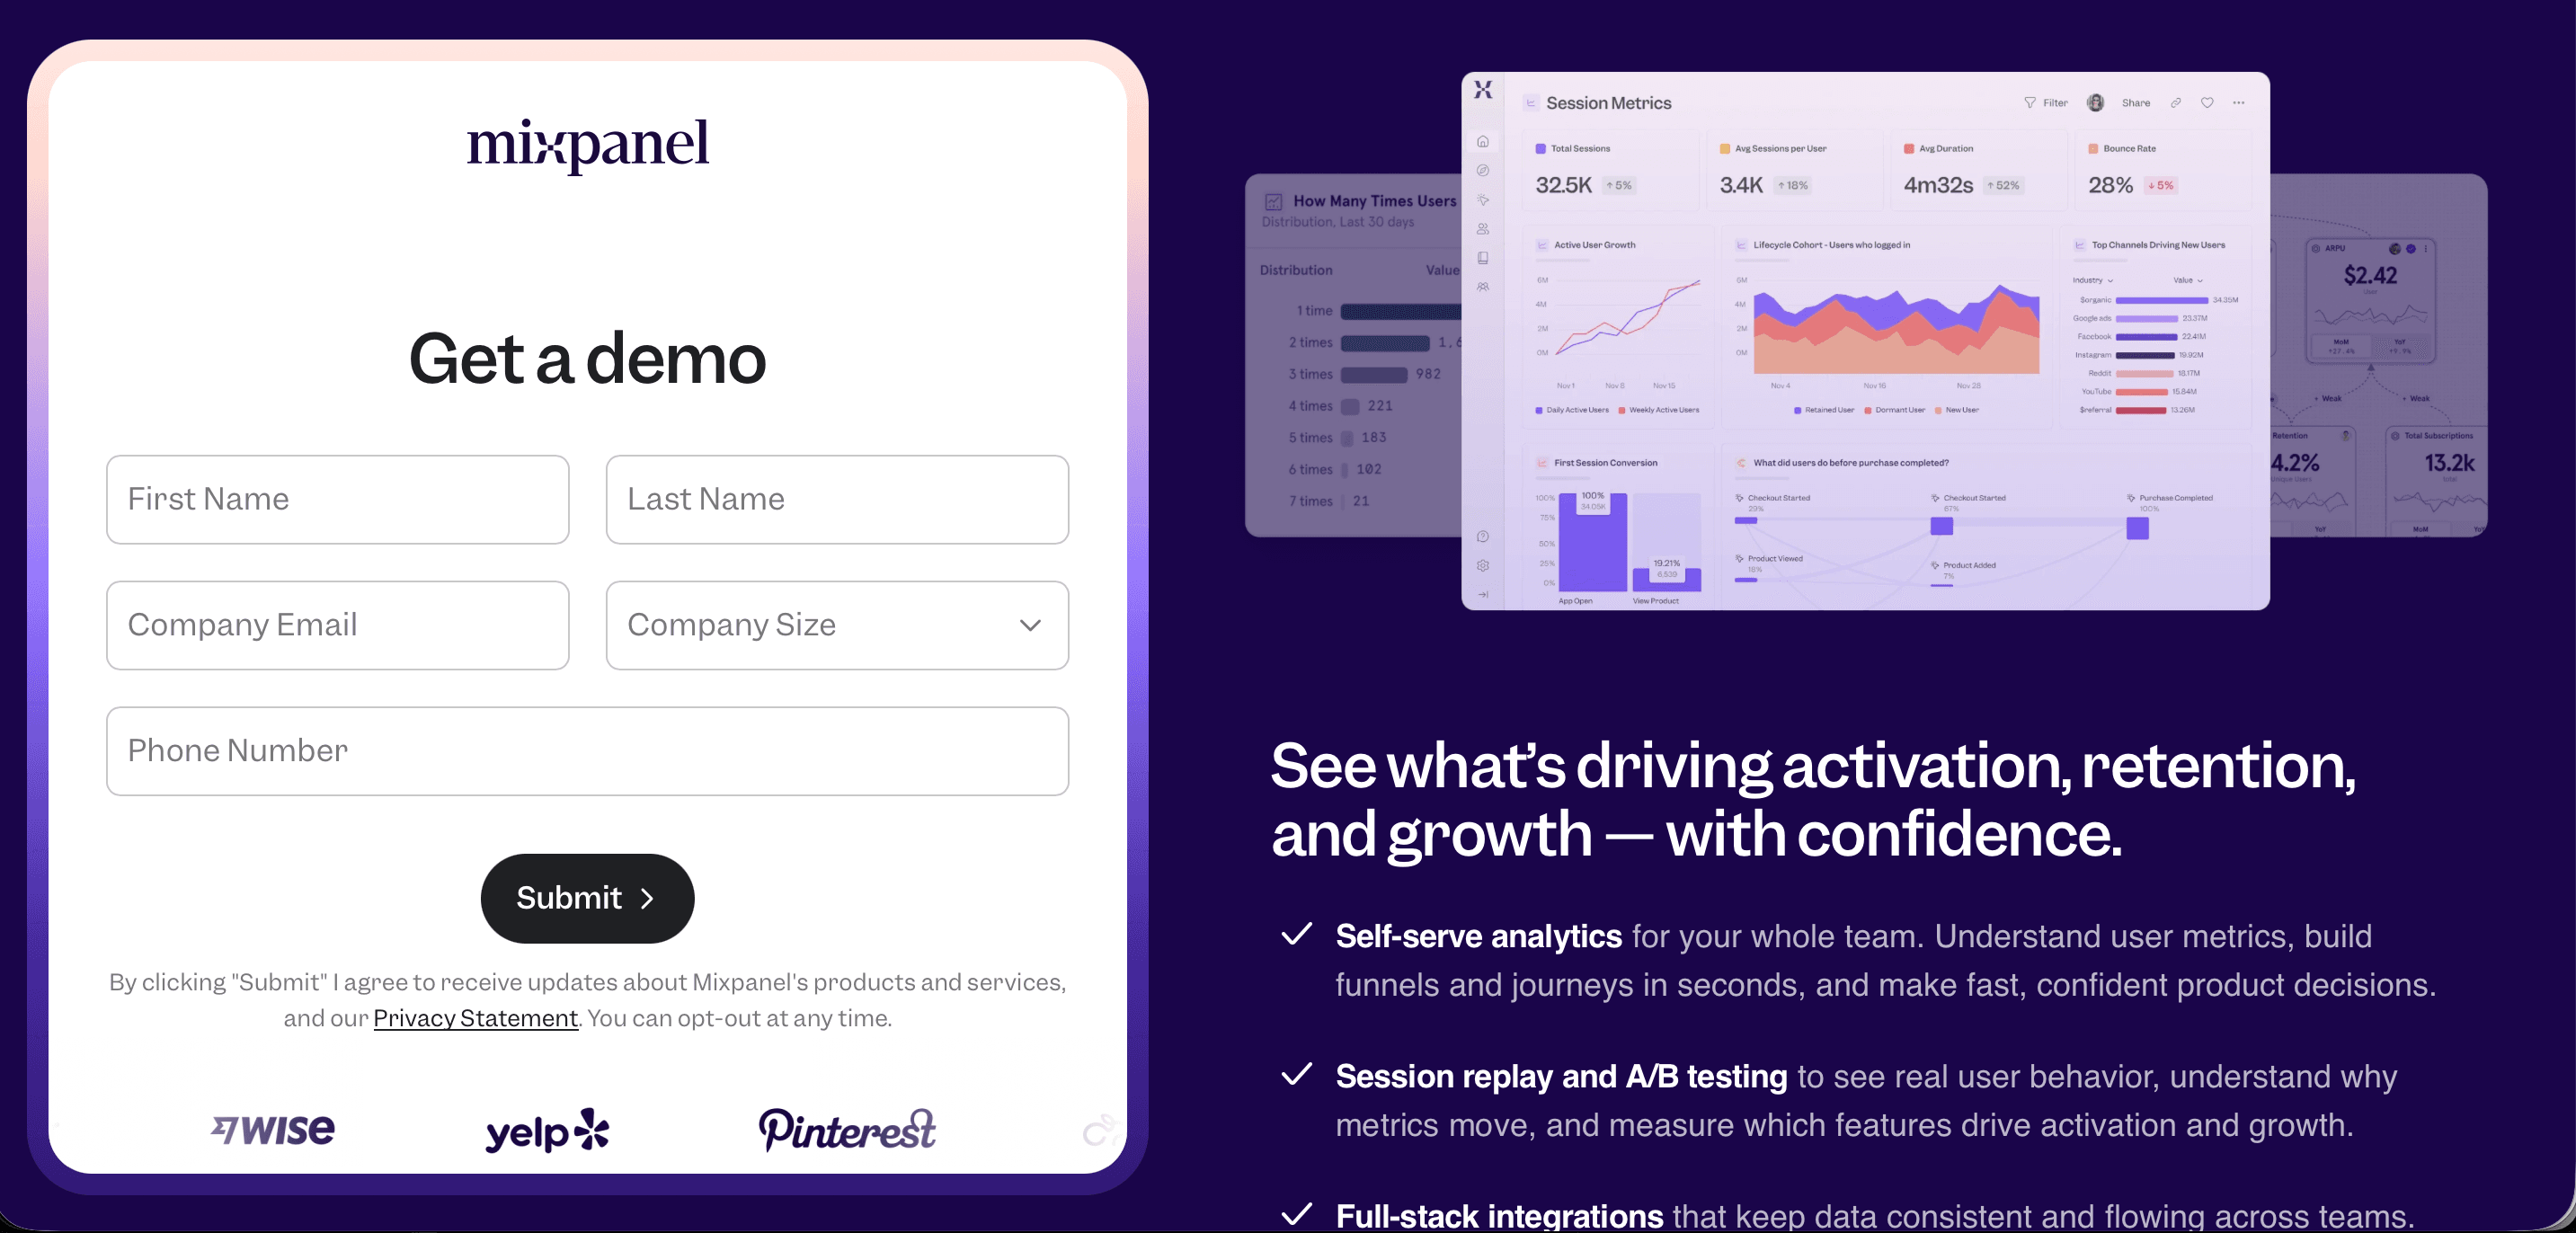
Best for: Product and growth teams that need event-based journey analytics
Mixpanel is a product analytics platform that maps user journeys through behavioral events — every click, page view, feature interaction, and conversion step tracked and visualized as a journey flow. Unlike heatmap tools, Mixpanel works from event data, giving teams precise, quantitative visibility into how users move through a product and where they drop off.
Contentsquare is an advanced digital experience analytics platform with strong journey visualization for web and mobile. It goes deeper than Hotjar on behavioral data — zone-based analysis, revenue attribution per content zone, and AI-powered anomaly detection — making it well-suited for large e-commerce and digital service businesses.
Key features
- Funnel analysis showing drop-off rates at every step of a defined journey
- User journey flows — visual paths showing what users actually do, not what you assume they do
- Retention analysis tracking whether users return after specific journey milestones
- Cohort analysis for comparing journey behavior across user segments
- Real-time data with no SQL required for most analyses
- Integration with Segment, Amplitude, and data warehouse tools
Limitation: Mixpanel is a quantitative behavioral analytics tool — it tells you what users do with high precision but not why they do it. No native survey, NPS, or qualitative feedback capability. Needs to be paired with a feedback tool for a complete journey picture.
Best for SaaS product teams, growth engineers, and mobile app teams that need precise funnel and flow analytics to optimize the digital product journey.
Pricing: Free plan available (up to 20M events/month). Paid plans from $28/month.
10. Microsoft Visio
Best for: Organizations in the Microsoft ecosystem that need basic journey documentation
Visio is Microsoft's diagramming tool, widely used in enterprise environments for process documentation. It includes journey map templates and integrates with Microsoft 365 tools, making it a practical choice for organizations that need basic journey visualization without adding a new tool to their stack.
Key features
- Journey map and swimlane templates
- Integration with Excel, SharePoint, and Teams
- Data linking to bring in external data
- Familiar interface for Microsoft-centric organizations
Limitation: No CX-specific features, no survey integration, no sentiment tracking. Purely a documentation tool with no measurement capability.
Best for: Enterprise IT and operations teams in Microsoft-heavy environments that need basic journey documentation.
Pricing: Included in Microsoft 365 Business plans or standalone from $5/user/month (web) to $15/user/month (desktop).
Quick Comparison of the Customer Journey Mapping Tool
| Tool | Best for | Feedback integration | Sentiment tracking | AI builder | Action plans | Free plan |
|---|---|---|---|---|---|---|
| SurveySparrow Journeys | CX measurement at every touchpoint | Native NPS, CSAT, CES | Per touchpoint + topics | Prompt-based | Native, with ownership + deadlines | Free trial |
| UXPressia | Visual journey documentation | Manual import | No | No | No | 1 project |
| Smaply | Service design deliverables | Manual import | No | No | No | Limited |
| Miro | Collaborative workshops | No | No | Basic | No | 3 boards |
| Lucidchart | Diagramming in M365/Google | Data linking | No | No | No | Limited |
| Qualtrics XM | Enterprise CX programs | Native | Advanced | Yes | Workflow-based | No |
| Medallia | Enterprise signal capture | Native | Advanced | Yes | Role-based alerts | No |
| Contentsquare | Digital product UX | On-site surveys | Limited | No | No | Yes |
| Mixpanel | Event-based product journey analytics | No | No | No | No | Upto 20M events |
| Microsoft Visio | Basic documentation in M365 | No | No | No | No | No |
How to Choose the Right Customer Journey Mapping Tool
If you need to measure satisfaction at specific touchpoints and see how sentiment shifts across the journey — the tools that offer native survey integration and automatic sentiment analysis are the right category. SurveySparrow Journeys, Qualtrics, and Medallia are the options here. Qualtrics and Medallia are enterprise-only with significant cost and implementation overhead. SurveySparrow Journeys is the option for mid-market teams that need measurement capability without enterprise complexity.
If you primarily need to document and communicate the journey — UXPressia and Smaply are purpose-built for this. Miro and Lucidchart work if you're already using them for other purposes and don't want to add another tool.
If your journey is primarily digital (web and app) — Hotjar covers the basics at an accessible price point. Contentsquare goes much deeper but at enterprise pricing.
If you're just getting started and budget is limited — start with a free plan from UXPressia or Miro to document the journey visually, and add SurveySparrow's free trial to begin connecting touchpoints to real feedback data. The two approaches complement each other.

Explore how SurveySparrow can transform your feedback process.
TRUSTED BY BEST-IN-CLASS BRANDS


What a Measurement-Driven Journey Map Looks Like in Practice
The difference between a documentation tool and a measurement tool becomes clear when you see what the data looks like.
With a documentation tool, you produce a map: a visual diagram showing the journey stages, the touchpoints within each stage, and the hypothetical emotions customers feel at each moment. It's useful for alignment and strategy — less useful for operational decision-making.
With a measurement-driven tool like SurveySparrow Journeys, you produce a living view of the customer experience:
- A trend chart showing that CSAT at the onboarding touchpoint averages 3.8/5 while CSAT at the support touchpoint averages 4.4/5 — meaning onboarding is your biggest improvement opportunity, not support
- Sentiment breakdown at the post-delivery touchpoint showing 72% positive, 18% neutral, 10% negative — with "packaging condition" extracted as the primary negative topic
- An action plan at the onboarding milestone assigned to the Customer Success team with a target of 4.2/5 CSAT by end of Q3
- Smart filter showing that enterprise accounts score 4.1/5 at renewal while SMB accounts score 3.6/5 — revealing a segment-specific retention risk
These are the insights that change decisions. They come from connecting the map to measurement — not from the map itself.
How to Set Up SurveySparrow Journeys in 5 Steps
For teams choosing SurveySparrow Journeys, setup is designed to be fast — the entire process from first login to live surveys at every touchpoint can be completed in a single session.
Step 1 — Choose your build method Navigate to Journeys from the SurveySparrow homepage and click "New Journeys." Choose from three paths: select an industry template, start from scratch, or click "Create with AI" and describe your journey in plain language. The AI builder generates a complete milestone and touchpoint structure from your prompt — review it, rename any stages that need adjustment, and proceed.
Step 2 — Add and name your milestones Milestones are the major lifecycle stages. Use the "+" icon to add new milestones or rename existing ones to reflect your specific journey. Common structures: Awareness → Onboarding → Active Use → Renewal for SaaS; Pre-purchase → Showroom → Post-purchase → Referral for automotive; Discovery → Purchase → Delivery → Loyalty for retail.
Step 3 — Add touchpoints within each milestone Within each milestone, add the specific interactions you want to measure using the "+" icon. Name each touchpoint precisely — "First support ticket resolution" is more actionable than "Support interaction." You can have multiple touchpoints per milestone, each with its own dedicated survey.
Step 4 — Assign surveys to each touchpoint Click "Add Survey" within any touchpoint and select the survey from your SurveySparrow library. Assign a CES survey to touchpoints where ease matters, CSAT where specific interaction quality matters, and NPS at relationship health milestones. Each touchpoint can use a different survey — mix and match across the same journey.
Step 5 — Add lanes for richer context Hover between rows within any milestone and click the "+" icon to add a lane. Lane options include: text (annotations and descriptions), topics (extracted sentiment themes from open-ended responses), action plans (with owner, deadline, and target metric), links (external references), and charts (widgets imported from the Executive Dashboard). Once surveys are live and responses flow in, the trend chart populates automatically — showing satisfaction movement across every milestone at a glance.
Explore how SurveySparrow can transform your feedback process.
TRUSTED BY BEST-IN-CLASS BRANDS


")

