Survey & Feedback
How to Easily Calculate Confidence Intervals for Your Study
Article written by Parvathi Vijayamohan
Content marketer at SurveySparrow.
9 min read
19 September 2025

1-Minute Summary
Purpose of Confidence Intervals provide a range that likely contains the true population parameter, offering insight into the precision of sample estimates.
4-Step Calculation Process:
- Determine Sample Proportion (P): Divide the number of favorable outcomes (X) by the total sample size (N).
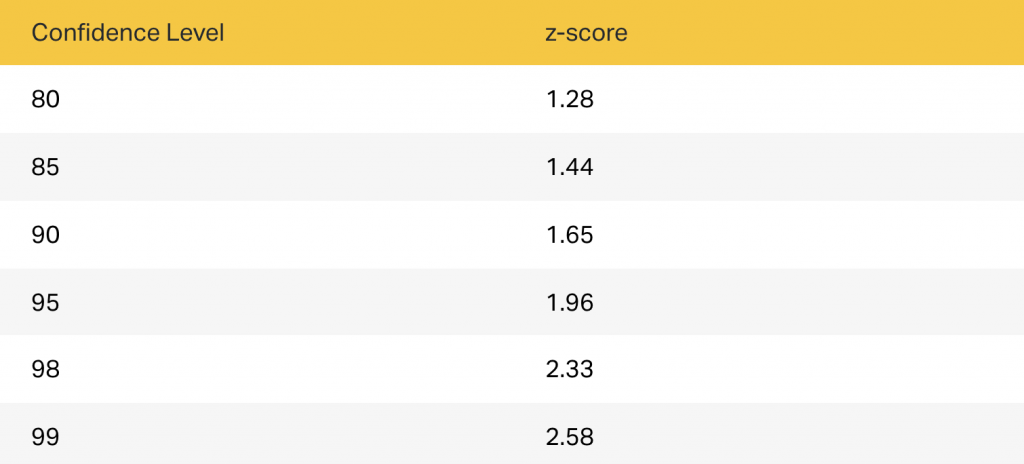
- Select Confidence Level (CL): Common levels include 90%, 95%, and 99%, each corresponding to a specific Z-score.
- Calculate Margin of Error (MoE): Use the formula MoE = Z * √[P(1-P)/N].
- Compute Confidence Interval: Add and subtract the MoE from the sample proportion to get the interval range.
I have a hard time with targets. Now, what does this have to do with ‘calculate confidence intervals‘?
When asked for a target number, I give ranges. Also, I sometimes have trouble predicting how long a task will take once I start it.
Researchers also face this problem. The results of polls, surveys, quizzes, or experiments are derived from a sample, not the entire population. Therefore, survey research is at its core an educated estimate – the result might not be 100% accurate.
That’s why confidence intervals are always useful when reporting on metrics. By doing this, you will be able to show your stakeholders how accurate your results are.
If you’re new to statistics or just a bit rusty, we’ll show you:
- An easy way to calculate confidence intervals.
- An example to demonstrate a confidence interval
- Quick recap: Just what is a confidence interval?
- Why do we do it?
- Five terms used in confidence interval calculations
Confidence interval calculator: 4 steps to calculate confidence intervals
To calculate a confidence interval this way, you will need:
- N = Sample size
- P = Sample proportion
- CL = Confidence Level
- MoE = Margin of Error
- Observed Score: The average or the result
Step 1: Calculate the sample proportion (p)
To calculate the sample proportion (P), divide the number of successful items (X) by the sample size (N).
P = X / N
Step 2: Choose the Confidence Level
You can choose from the 5 confidence levels below. Each level has a score associated with it.

Step 3: Calculate the Margin of Error
Okay, you’ve got your sample size, sample proportion, and Confidence Level.
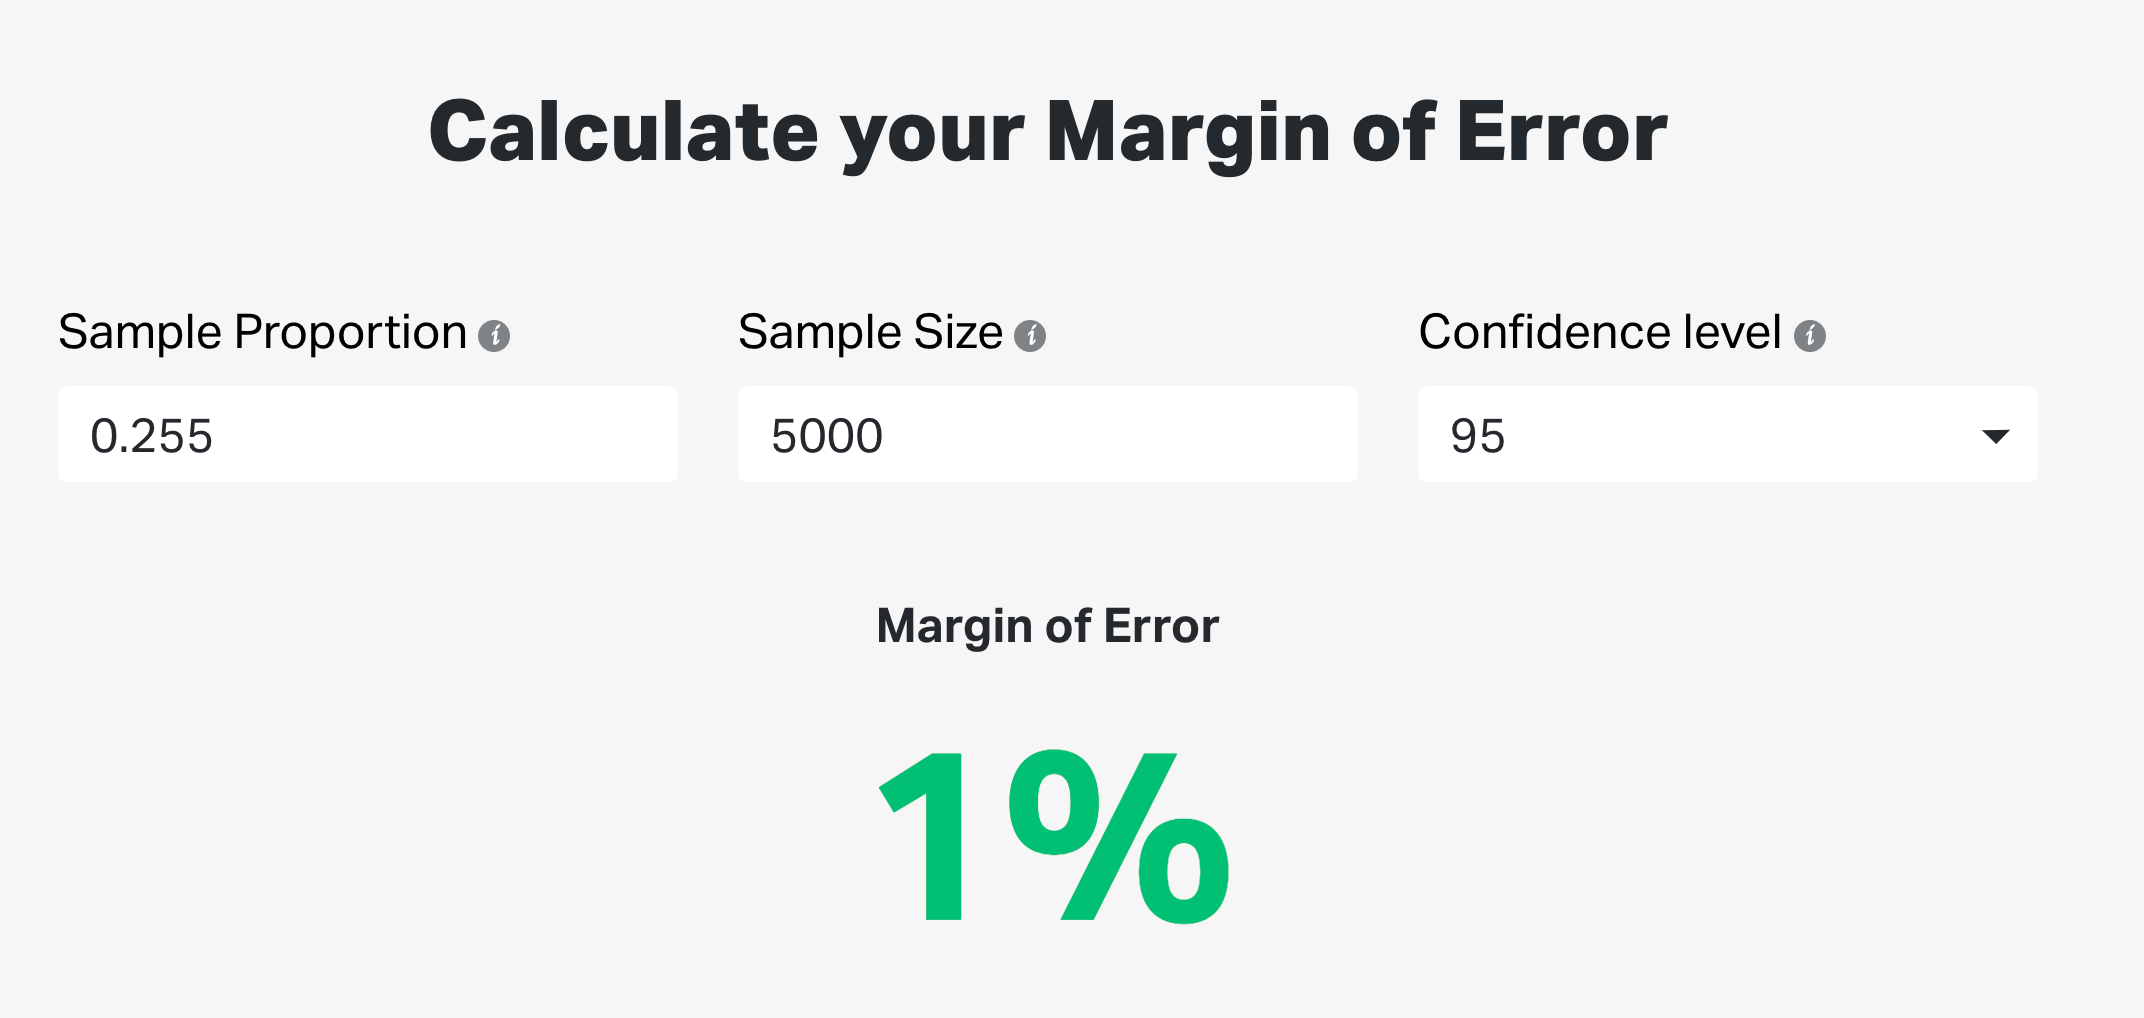
Time to calculate the Margin of Error. Head to our MOE calculator and enter the numbers.
Step 4: Estimate the Confidence Interval
You can easily calculate the confidence intervals when you put together the Margin of Error and observed score.
A confidence interval example
Suppose we want to find out the most popular beverage at the nearby Starbucks.
We randomly collect a sample of 5,000 people entering Starbucks over a month. So our sample size is:
N = 5,000
Based on the order data, we found out that from this sample, 1,276 people ordered a Pumpkin Spice Latte. So, our sampling proportion will be:
P = 1,276/5,000 = 0.255
Since we’re reasonably confident that the sample order data is reflective of the actual population of Starbucks customers, we choose a Confidence interval of 95%
Time to calculate the Margin of Error. We feed the numbers into the calculator, and voila.

Our margin of error is +/-1%.
To recap: According to our observed score, 25.52% of our Starbucks sample stated that the Pumpkin Spice Latte is their preferred cuppa, and we have a margin of error of +/- 1%.
So we can say that 24% to 26% of Starbucks customers prefer the Pumpkin Spice Latte. And there you go!
There are formulas for calculating confidence intervals in specific scenarios that use other components like mean or standard deviation. As an example, here’s a great blog on calculating confidence intervals for A/B testing.
What I’ve shared here is simply a shortcut to get the data you need.
While you can use SurveySparrow’s free calculator anytime, a free trial gives you unlimited access to 600+ customizable survey templates + features which will massively speed up your data collection process.
Sign up below to get a full-featured free trial.
14-day free trial • Cancel Anytime • No Credit Card Required • No Strings Attached
What is a confidence interval in simple words?
Let us take a detour to understand what a confidence interval is.
In simple terms, confidence intervals are based on an average score, as we saw in the example above, plus or minus some sampling error. In other words, it provides a ballpark within which you can place your estimate.
Why do we calculate confidence intervals?
- Confidence intervals lend reliability to random sampling studies.
- It indicates how stable your estimate is if the study is done repeatedly. Ideally, there should be a minimum deviation from the original estimate.
- Confidence intervals are also a pretty good way of representing the variability in your data.
- Moreover, confidence intervals help determine mean changes between different samples.
For example:
- An ad agency runs two different campaigns for a client within 10 stores each.
- They calculate the average sales from each campaign
- They then create confident intervals to measure the difference between results.
5 terms used to calculate confidence intervals
#1. Sample Size
Sample size is the number of items or subjects included in a sample in research. This sample will represent the target population of a study.
For example, suppose we want to predict how customers in California and Singapore will react to a product rebranding. In that case, we can first test it on samples representing customers from these countries. The sample size, in this case, will be the number of people from each country to be surveyed.
According to Piroska Bisits-Bullen, Head of Data at Umbo, “A good maximum sample size is usually around 10% of the population, as long as this does not exceed 1000.” For more easy tips to choose a sample size, check out her blog.
Related: Sample Size Calculator – Slovin’s Formula to Calculate Sample Size
#2. Observed Score and True Score
Raluca Budiu, Director of Research, Nielsen Norman Group, explains it well:
“For example, you may want to know the percentage of users, out of your whole target population, who are able to successfully place an order on an ecommerce website.
Unless your audience is tiny, you will have thousands of users and it will be unfeasible to determine that number precisely — after all, to compute it, you would need to ask every single member of your audience to place an order on your site and record whether they were successful.
This value of the metric based on the entire population is called the true score — it is something that cannot be determined exactly. However, it is possible to estimate it.”
This is what we do with sample size. The result from the study then gives us an observed score; we use this to estimate the true score.
#3. Sample Proportion
Wait, we already have a sample size? So what is this sampling proportion all about?
Well, sampling is an experiment for a particular characteristic, right? So in simple terms, a sampling proportion is the share of subjects who have successfully shown that characteristic.
The ideal sampling proportion varies according to your research goals.
For example, suppose you want to get the proportion of defective items coming off an assembly line. Ideally, you want the ratio to be as low as possible, or it won’t look good for your company! In contrast, if you’re surveying people in a hardware store who make a purchase before leaving, you want the proportion to be high.
#4. Confidence Level
To quote from our blog on sample size calculation: “Confidence level is the term used to express how confident you are that your sample size for the survey represents the population size.”
Confidence levels are always represented as a percentage. For example, a 90% confidence level means that if you repeat a survey, 90 percent of the time the results will match the actual results from a larger population.
In other words, your data is reliable!
#5. Margin of Error
The Margin of Error reflects the amount of sampling error in your survey results. The larger the margin of error, the less confidence one should have that the observed score reflects the true score of the population.
To quote again from our previous blog:
“For example, if you measure customer experience, let’s assume that if we were to average out the satisfaction score of all your customers, that number out of 10 would be an 8. Now, we obviously cannot survey all your customers, so let’s say we surveyed your sample.
Would you be alright with getting a customer satisfaction score in your survey of 7.5? Or perhaps 8.5? It wouldn’t be precise, but it would be somewhere in the ballpark.
In the above example, your margin of error is about 0.5, expressed in percentage as 5%. Usually, a margin of error between 4% and 8% is acceptable and still gives you meaningful results.”
Calculate Confidence Intervals: A Note of Caution
We sometimes interpret confidence intervals to mean that the true score lies within its range. But this is far from true (see what I did there? No?).
A confidence interval only tells us the range of numbers we can expect to get if we do the same study again, in the same way. So to get an observed score that’s close to the true score, it is better to look at your sample and research methods.
Secondly, a confidence interval is an indicator. It is not meant for drawing any conclusions or insights about the target population.
We hope we could help you with this guide for calculating confidence intervals the easy way. Share your comments or suggestions below. Happy surveying!

Create engaging surveys that people actually complete. Try SurveySparrow now!
Parvathi Vijayamohan
Parvathi is a sociologist turned marketer. After 6 years as a copywriter, she pivoted to B2B, diving into growth marketing for SaaS. Now she uses content and conversion optimization to fuel growth - focusing on CX, reputation management and feedback methodology for businesses.
Frequently Asked Questions (FAQs)
A confidence interval is a range derived from sample data that likely contains the true population parameter, providing a measure of estimate reliability.
They quantify the uncertainty around a sample estimate, allowing researchers to assess the precision and reliability of their findings
Common choices are 90%, 95%, and 99%. A higher confidence level offers greater certainty but results in a wider interval
Sample size, variability in the data, and the chosen confidence level all influence the interval's width. Larger samples and lower variability lead to narrower intervals.
Yes, they can be applied to proportions, means, and other statistics, with specific formulas tailored to each data type.
Related Articles

Survey & Feedback
Best Time To Send A Survey for Maximum Responses
14 MINUTES
12 June 2021

Survey & Feedback
Complete Guide to In-App Feedback: Importance & Best Practices
12 MINUTES
20 March 2024

Survey & Feedback
Types of Public Opinion Polls: Meaning, Types, Methods & Their Significance
14 MINUTES
11 March 2024

Survey & Feedback
How AI Integrations in Surveys Can Boost CX
11 MINUTES
3 July 2023
